הקלטת מעקב מערכת
קל לארגן דפים בעזרת אוספים
אפשר לשמור ולסווג תוכן על סמך ההעדפות שלך.
במעקב מערכת מוצגות פעילויות ונתוני שימוש במשאבים ברמת המערכת, כך שאפשר לראות איך התהליכים של האפליקציה מתוזמנים ומופעלים. תצוגת המעקב אחר המערכת בכלי לניתוח ביצועים (profiler) ב-Android Studio משמשת בדרך כלל לבדיקת המקרים הבאים:
- איך תהליכי האפליקציה והמערכת מתפלגים בין הליבות והת'רדים של המכשיר.
- עד כמה הרינדור של ממשק המשתמש חלק.
- צריכת החשמל ברמת המכשיר וברמת האפליקציה.
בדף הזה יש סקירה כללית של האמצעים החזותיים הנפוצים ביותר בתצוגת המעקב של המערכת. במילון המונחים של התרשימים אפשר למצוא פרטים נוספים על תרשימים שלא מתוארים כאן. דוגמאות מפורטות יותר לשימוש במעקב מערכת מופיעות בדפים האחרים בקטע הזה.
אחרי הקלטת מעקב מערכת, מוצגים ההדמיות הבאות בציר זמן. כדאי להתמקד בקשר בין משאבי המערכת השונים. לדוגמה, אם מבחינים בעלייה חדה ב-modem power rail, כדאי לעבור לקטע threads ולראות איזו פעילות של thread עלולה לגרום לעלייה החדה באותו זמן.

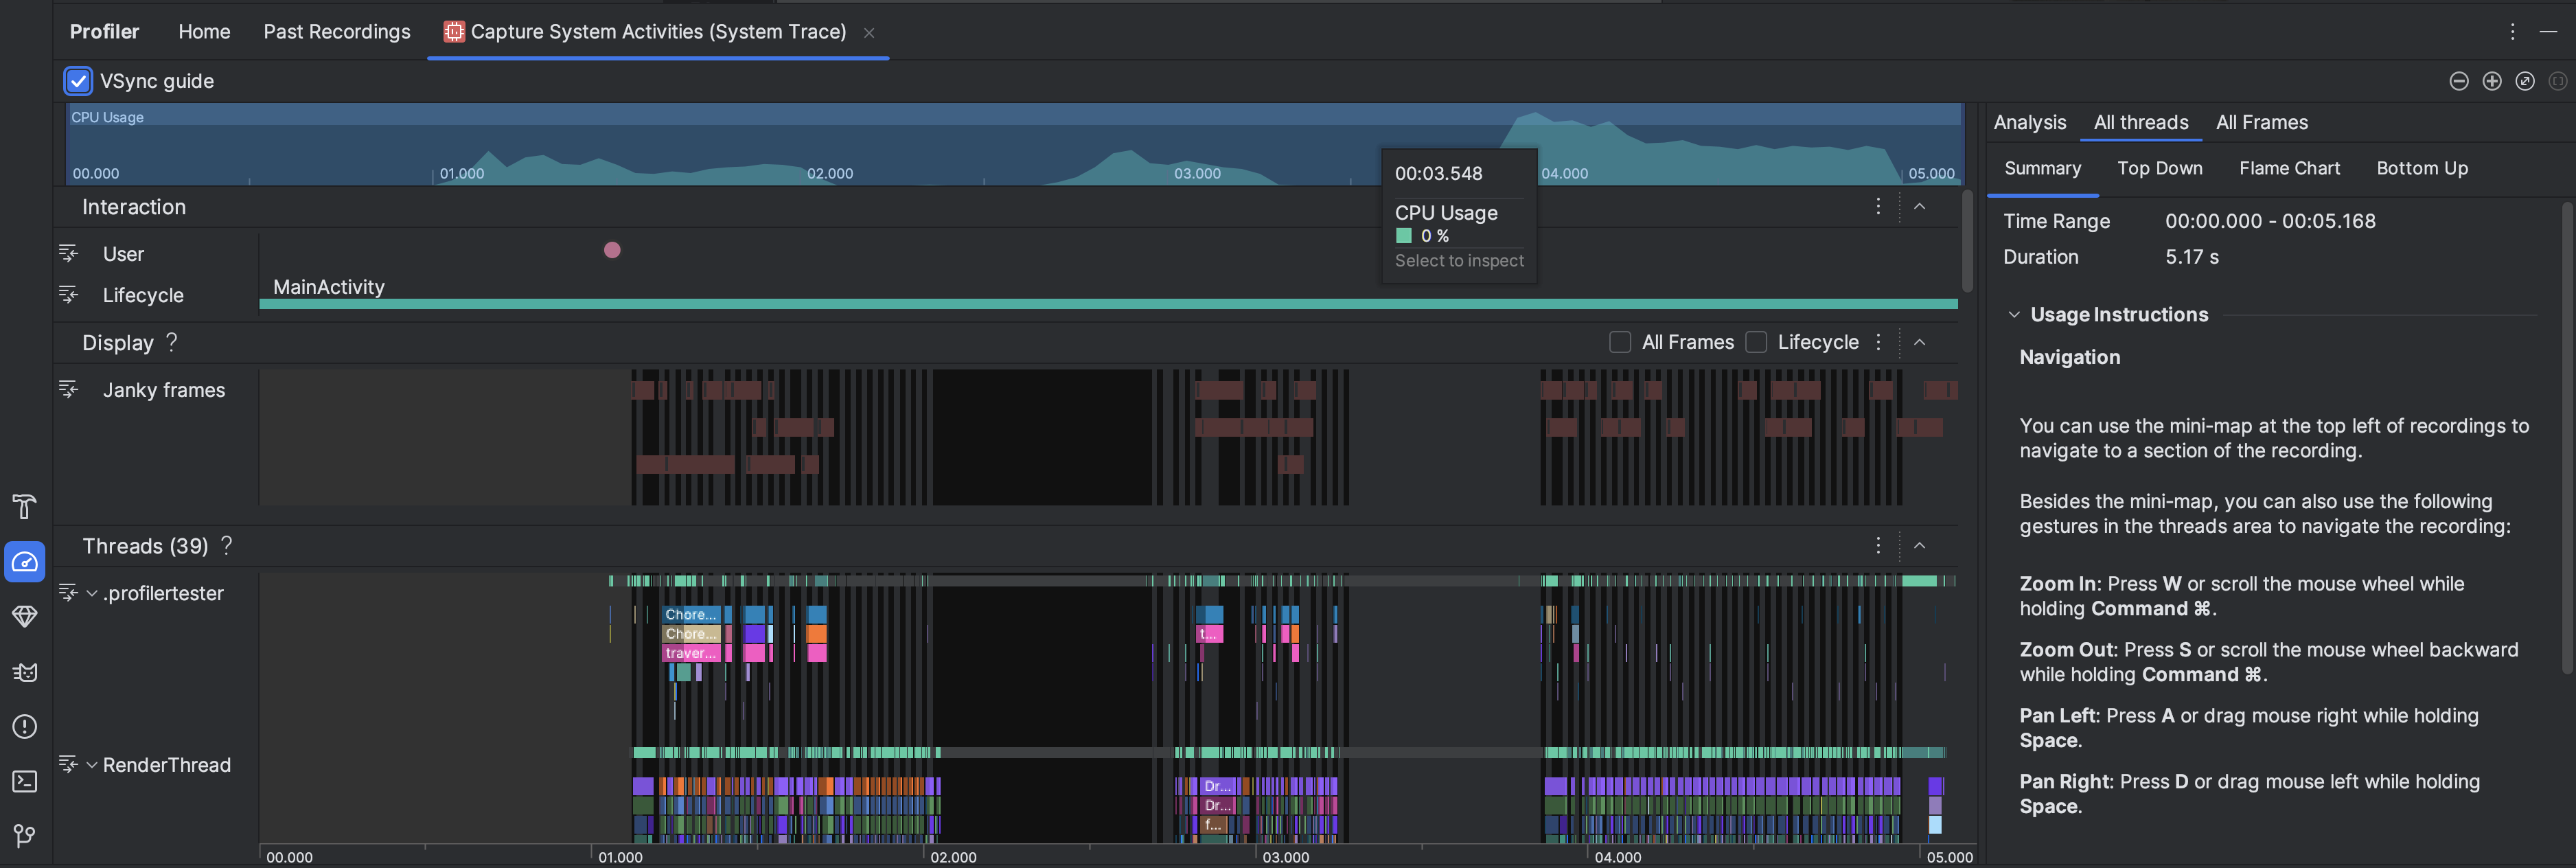
- CPU Usage (שימוש במעבד): מציג את השימוש במעבד של האפליקציה כאחוז מתוך סך הקיבולת הזמינה של המעבד לפי זמן. מסמנים קטע בציר הזמן כדי לסנן את הפרטים לפי התקופה הזו.
- אינטראקציות: מציג אינטראקציות של משתמשים ואירועים במחזור החיים של האפליקציה לאורך ציר זמן (נדרש תהליך אפליקציה ניתן לניפוי באגים ומכשיר עם API ברמה 26 ומעלה).
- תצוגה: מציג מידע שקשור למידת החלקות של רינדור ממשק המשתמש של האפליקציה. בוחרים באפשרות מחזור חיים כדי לבדוק כמה זמן לוקח לאפליקציה לעבד כל פריים בשרשור הראשי וב-
RenderThread
. המידע הזה שימושי לבדיקת צווארי בקבוק שגורמים לבעיות בממשק (jank) ולשיעורי פריימים נמוכים.
Threads: מציג את ה-threads שהאפליקציה ותהליכי מערכת שונים פועלים בהם. במאמר זיהוי תנודות בממשק המשתמש מוסבר איך להשתמש במעקב אחר המערכת כדי לחקור ולצמצם את התנודות בממשק המשתמש.
כדאי לדעת: כשבודקים את ציר הזמן של
Threads, אפשר להשתמש במקשי הקיצור הבאים:
- הגדלת התצוגה: מקישים על W או גוללים את גלגל העכבר תוך כדי לחיצה על Ctrl (Command ב-macOS).
- הקטנת התצוגה: מקישים על S או גוללים את גלגל העכבר אחורה תוך כדי לחיצה על Ctrl (Command ב-macOS).
- הזזה שמאלה: לוחצים על A או גוררים את העכבר ימינה תוך כדי לחיצה על מקש הרווח.
- הזזה ימינה: לוחצים על D או גוררים את העכבר שמאלה תוך כדי לחיצה על מקש הרווח.
- כדי להרחיב או לכווץ שרשור: לוחצים לחיצה כפולה על שם השרשור או מקישים על Enter כששרשור מסוים מסומן.
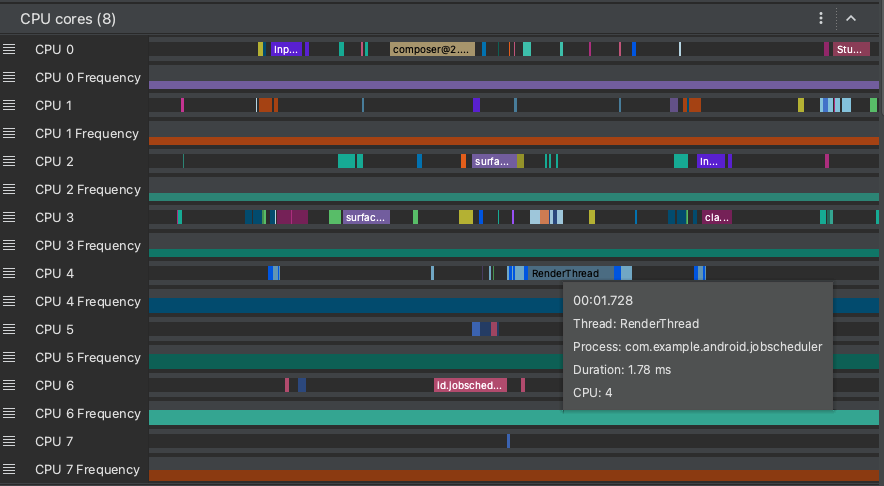
ליבות CPU: מוצגת הפעילות בכל ליבה במכשיר. הצגת הפעילות לפי ליבה יכולה לתת לכם מושג אילו ליבות הן הליבות ה"גדולות" או ה"קטנות" במעבדים ניידים מודרניים. מעבירים את מצביע העכבר מעל פעילות בשרשור כדי לראות באיזה שרשור הליבה הזו פועלת באותו רגע.

זיכרון תהליך (RSS): כמות הזיכרון הפיזי שנמצא כרגע בשימוש באפליקציה. פרטים נוספים זמינים במילון המונחים של התרשים.
Power Rails: מופיע כשמבצעים פרופיל במכשיר פיזי. מידע נוסף זמין במאמר בדיקת צריכת החשמל.
סוללה: מציג את השימוש בסוללה של האפליקציה.
דוגמאות התוכן והקוד שבדף הזה כפופות לרישיונות המפורטים בקטע רישיון לתוכן. Java ו-OpenJDK הם סימנים מסחריים או סימנים מסחריים רשומים של חברת Oracle ו/או של השותפים העצמאיים שלה.
עדכון אחרון: 2025-07-27 (שעון UTC).
[null,null,["עדכון אחרון: 2025-07-27 (שעון UTC)."],[],[],null,["# Record a system trace\n\nA system trace shows you system-wide activities and resource usage, so you can\nsee how your app processes are scheduled and run. The system trace view in the\nAndroid Studio Profiler is commonly used to investigate the following:\n\n- How app and system processes are distributed across device cores and threads.\n- How smoothly the UI renders.\n- Power usage at both the device and app level.\n\nThis page provides an overview of the most commonly used visuals in the system\ntrace view. See the [chart glossary](/studio/profile/chart-glossary/flame-chart)\nfor more details about visualizations not described here. For more detailed\nexamples of what to use a system trace for, see the other pages in this section.\n\nAfter you [record a system trace](/studio/profile#start-profiling), you see the\nfollowing visualizations displayed over a timeline. You should focus on how\ndifferent system resources are correlated; for example, if you notice a spike in\nthe modem power rail, you should go to the threads section and see what thread\nactivity could be causing the spike at the time.\n\n- **CPU Usage**: Shows CPU usage of your app as a percentage of total available CPU capacity by time. Highlight a section of the timeline to filter to the details for that time period.\n- **Interactions** : Shows user interaction and app lifecycle events along a timeline (requires a [debuggable](/studio/profile#profileable-v-debuggable) app process and a device running API level 26 or higher).\n- **Display** : Shows info related to how smooth your app UI renders. Select **Lifecycle** to inspect how long it takes your app to render each frame on the main thread and `RenderThread`. This info is helpful for [investigating\n bottlenecks that cause UI jank and low\n framerates](/studio/profile/jank-detection).\n- **Threads** : Shows the threads that your app and various system processes run\n on. To learn about how to use system traces to investigate and help reduce UI\n jank, see [Detect UI jank](/studio/profile/jank-detection).\n\n **Tip:** When inspecting the **Threads** timeline, the following shortcuts are available:\n - **Zoom in:** Press \u003ckbd\u003eW\u003c/kbd\u003e or scroll the mouse wheel while holding \u003ckbd\u003eCtrl\u003c/kbd\u003e (\u003ckbd\u003eCommand\u003c/kbd\u003e on macOS).\n - **Zoom out:** Press \u003ckbd\u003eS\u003c/kbd\u003e or scroll the mouse wheel backward while holding \u003ckbd\u003eCtrl\u003c/kbd\u003e (\u003ckbd\u003eCommand\u003c/kbd\u003e on macOS).\n - **Pan left:** Press \u003ckbd\u003eA\u003c/kbd\u003e or drag mouse right while holding \u003ckbd\u003eSpace\u003c/kbd\u003e.\n - **Pan right:** Press \u003ckbd\u003eD\u003c/kbd\u003e or drag mouse left while holding \u003ckbd\u003eSpace\u003c/kbd\u003e.\n - **Expand or collapse a thread:** Double-click the thread name or press \u003ckbd\u003eEnter\u003c/kbd\u003e while a thread is selected.\n- **CPU cores** : Shows the activity on each core in your device. Viewing the\n activity by core might give you an idea of which ones are the [\"big\" or\n \"little\" cores](https://en.wikipedia.org/wiki/ARM_big.LITTLE) in\n modern mobile processors. Hold the pointer over a thread activity to\n see which thread this core is running on at that particular time.\n\n- **Process Memory (RSS)**: Shows the amount of physical memory currently in use\n by the app. For more details, see the chart glossary.\n\n- **Power Rails** : Appears when you profile on a physical device. For more info,\n see [Inspect power usage](/studio/profile/power-profiler).\n\n- **Battery**: Shows your app's battery usage."]]