
如果应用响应速度缓慢、动画播放不流畅、卡顿或耗电量过高,则会导致性能不佳。若要解决性能问题,就需要对应用进行性能分析,或者找出应用的哪些方面导致不能高效地利用资源(例如 CPU、内存、图形或设备电池)。本主题介绍了可用于解决常见性能问题的 Android Studio 工具和技术。
如需了解如何在不运行整个 Android Studio IDE 的情况下运行独立性能分析器(仅限 Windows 或 Linux),请参阅运行独立性能分析器。
要求
如需对应用进行性能分析,我们建议您具备以下条件:
具有已启用
profileable清单配置的发布 build 变体的应用,也称为可分析应用。默认情况下,应用将此配置设置为 true。如需检查或更改此配置,请打开应用的清单或AndroidManifest.xml文件,然后在<application>部分中查找profileable清单配置:<profileable android:shell="true" />搭载 API 级别 29 或更高级别且具有 Google Play 的虚拟或实体测试设备。
Android Gradle 插件 7.3 或更高版本。
可分析应用与可调试应用
借助可分析性能的应用,您可以执行大多数常见的性能分析任务,但如果您需要记录 Java/Kotlin 分配或捕获堆转储,则应改用可调试应用。如果应用进程可调试,并且设备搭载 API 级别 26 或更高级别,您还可以在提供 Interaction 时间轴的任务视图中查看该时间轴,其中会显示用户互动和应用生命周期事件。
可调试应用基于应用的 debug build 变体,可让您使用调试程序等开发工具;不过,这会带来一些性能开销。可分析性能的应用基于应用的 release build 变体,可执行部分常见的性能分析任务,而无需承担调试 build 的性能开销。
构建和运行可分析应用
如需在 Android Studio 中构建和运行可分析性能的应用,请按以下步骤操作:
- 如果您还没有运行/调试配置,请创建运行/调试配置。
- 选择您的发布 build 变体 (Build > Select Build Variant)。
- 依次点击更多操作
 > 以低开销配置“app”进行性能分析
 或以完整数据配置“app”进行性能分析
 (“app”是运行配置的名称,因此对您而言可能有所不同)。如需在这两种选项之间进行选择,请参阅要求。
应用会在测试设备上打开,并且 Profiler 窗格会在 Android Studio 中打开。
(“app”是运行配置的名称,因此对您而言可能有所不同)。如需在这两种选项之间进行选择,请参阅要求。
应用会在测试设备上打开,并且 Profiler 窗格会在 Android Studio 中打开。
如果这些说明对您不适用,请参阅手动构建和运行可分析应用。
开始分析
如需启动性能分析任务,请按以下步骤操作:
从性能分析器窗格中的首页标签页列表中选择一个进程。在大多数情况下,您需要选择代表应用的顶层进程。
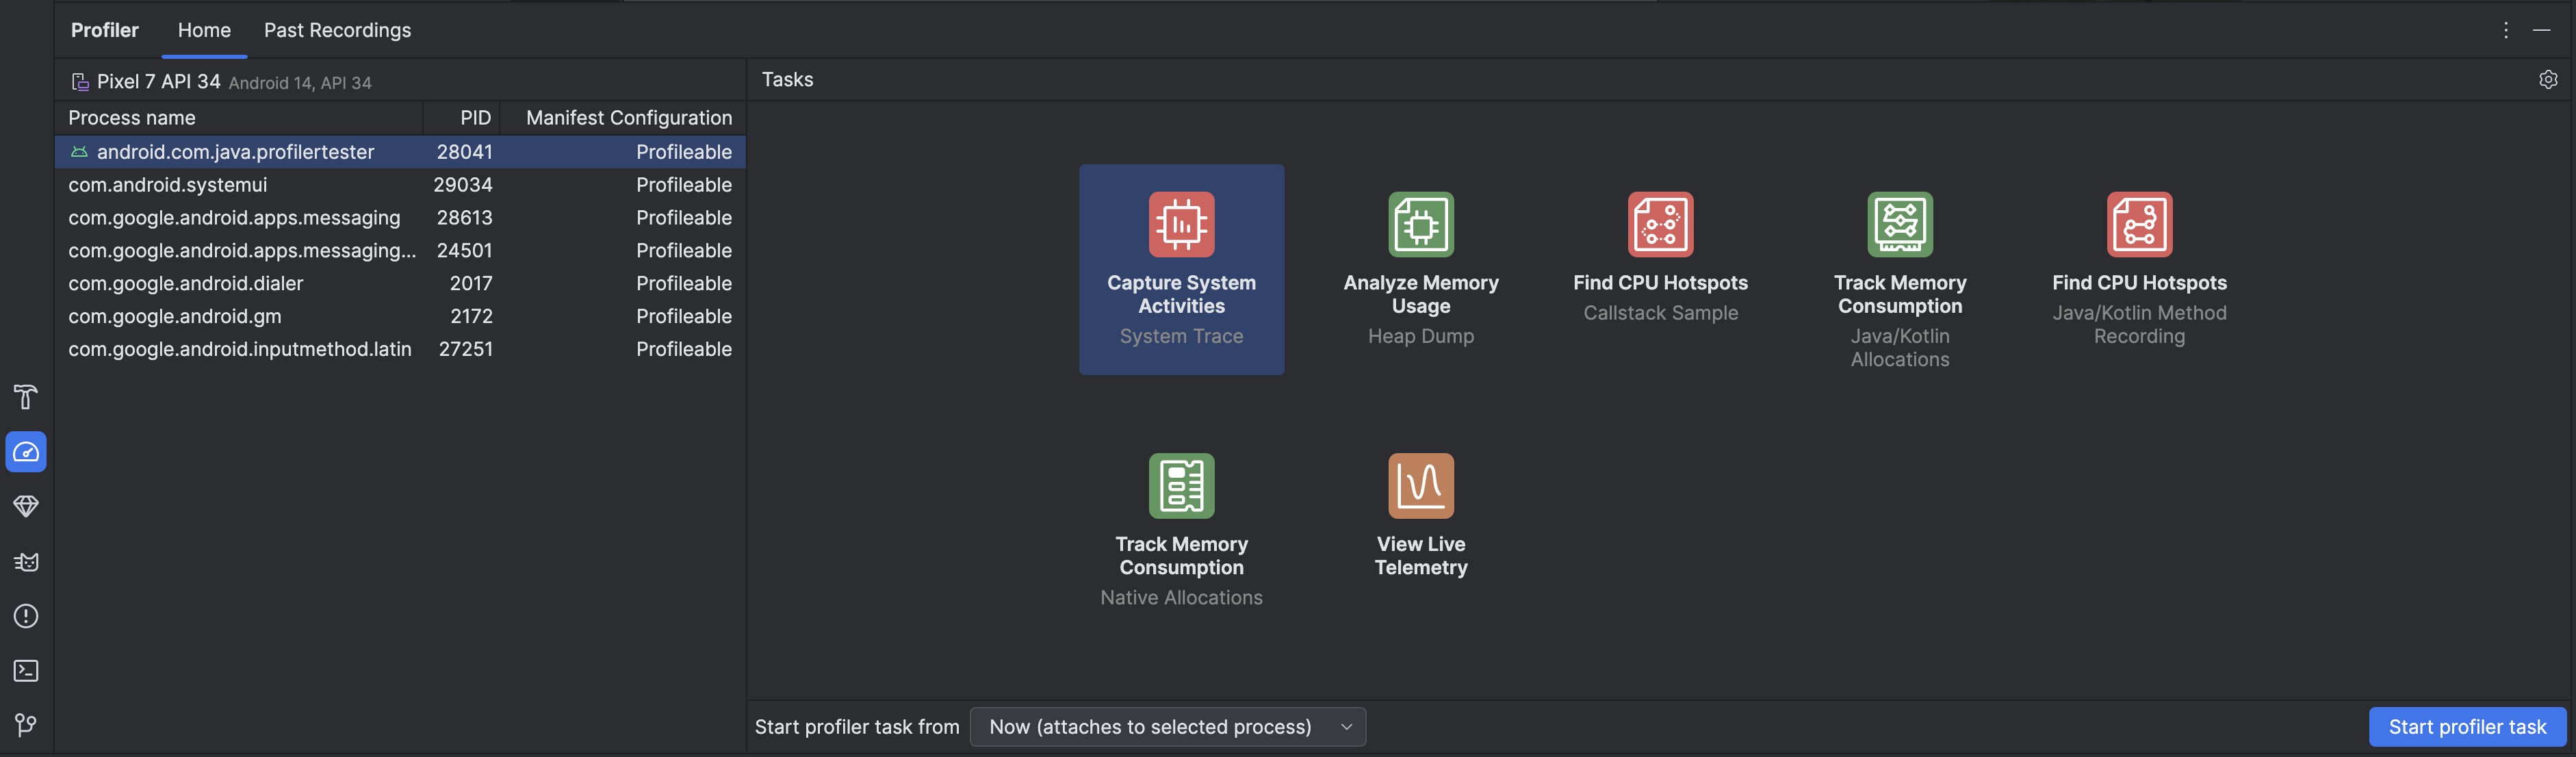
从任务部分中选择一个性能分析任务。如需详细了解这些任务,请参阅本部分中的其他页面。并非所有性能分析任务都适用于每个进程。如果您不确定从何处着手,可以通过实时检查应用来全面了解性能活动。
使用从何处启动性能分析器任务下拉菜单,选择是从启动开始启动性能分析器任务,还是在进程运行时附加到进程。如果您尝试缩短应用启动时间或捕获应用启动期间发生的进程,则应添加启动时间;否则,您可以从应用的当前状态开始进行性能分析。
点击启动性能分析器任务。任务会在自己的标签页中开始运行。
与您的应用交互,以便触发 activity。
停止录制(如果适用),等待系统解析,然后查看结果。
比较、导出和导入轨迹
当您停止性能分析任务时,系统会自动将其保存在性能分析器窗格中的过往记录标签页中。您可以使用这些已保存的记录来比较不同场景中的资源使用情况。录制内容会在当前 Android Studio 会话期间保存;如果您想将其保留更长时间,请点击导出录制内容
 进行导出。并非所有轨迹类型都可以导出。
如需导入轨迹(例如从之前运行的 Android Studio 中导入),请点击 Past Recordings 标签页中的 Import record
 ,然后选择轨迹文件。您还可以将文件拖动到 Android Studio 编辑器窗口来导入该文件。
修改录制配置
如需修改性能分析器任务记录配置,请点击性能分析器设置  。您可以切换主要的两项设置:
- 对于涉及采样的任务,采样间隔表示每次采样之间的时间。指定的时间间隔越短,达到记录数据的文件大小限制就越快。
- File size limit 表示可以写入连接设备的数据量。当您停止记录时,Android Studio 会解析此数据并将其显示在性能分析器窗口中。如果您提高此限制并记录大量的数据,Android Studio 解析文件所需的时间会大大增加,并且可能会变得无响应。