Esaminare l'app in tempo reale
Mantieni tutto organizzato con le raccolte
Salva e classifica i contenuti in base alle tue preferenze.
L'ispezione della tua app live offre una panoramica generale dell'utilizzo della CPU
del dispositivo, dell'attività dei thread e dell'utilizzo della memoria. Se non sai da dove iniziare a profilare la tua app, utilizza la visualizzazione in tempo reale per eseguire un'analisi esplorativa, quindi approfondisci con le attività di profilazione specifiche quando noti un comportamento che può essere ottimizzato.
Per avviare la visione in diretta,
seleziona l'attività di profilazione Visualizza telemetria in tempo reale.
Quando l'attività inizia, vengono visualizzate in tempo reale le seguenti visualizzazioni:
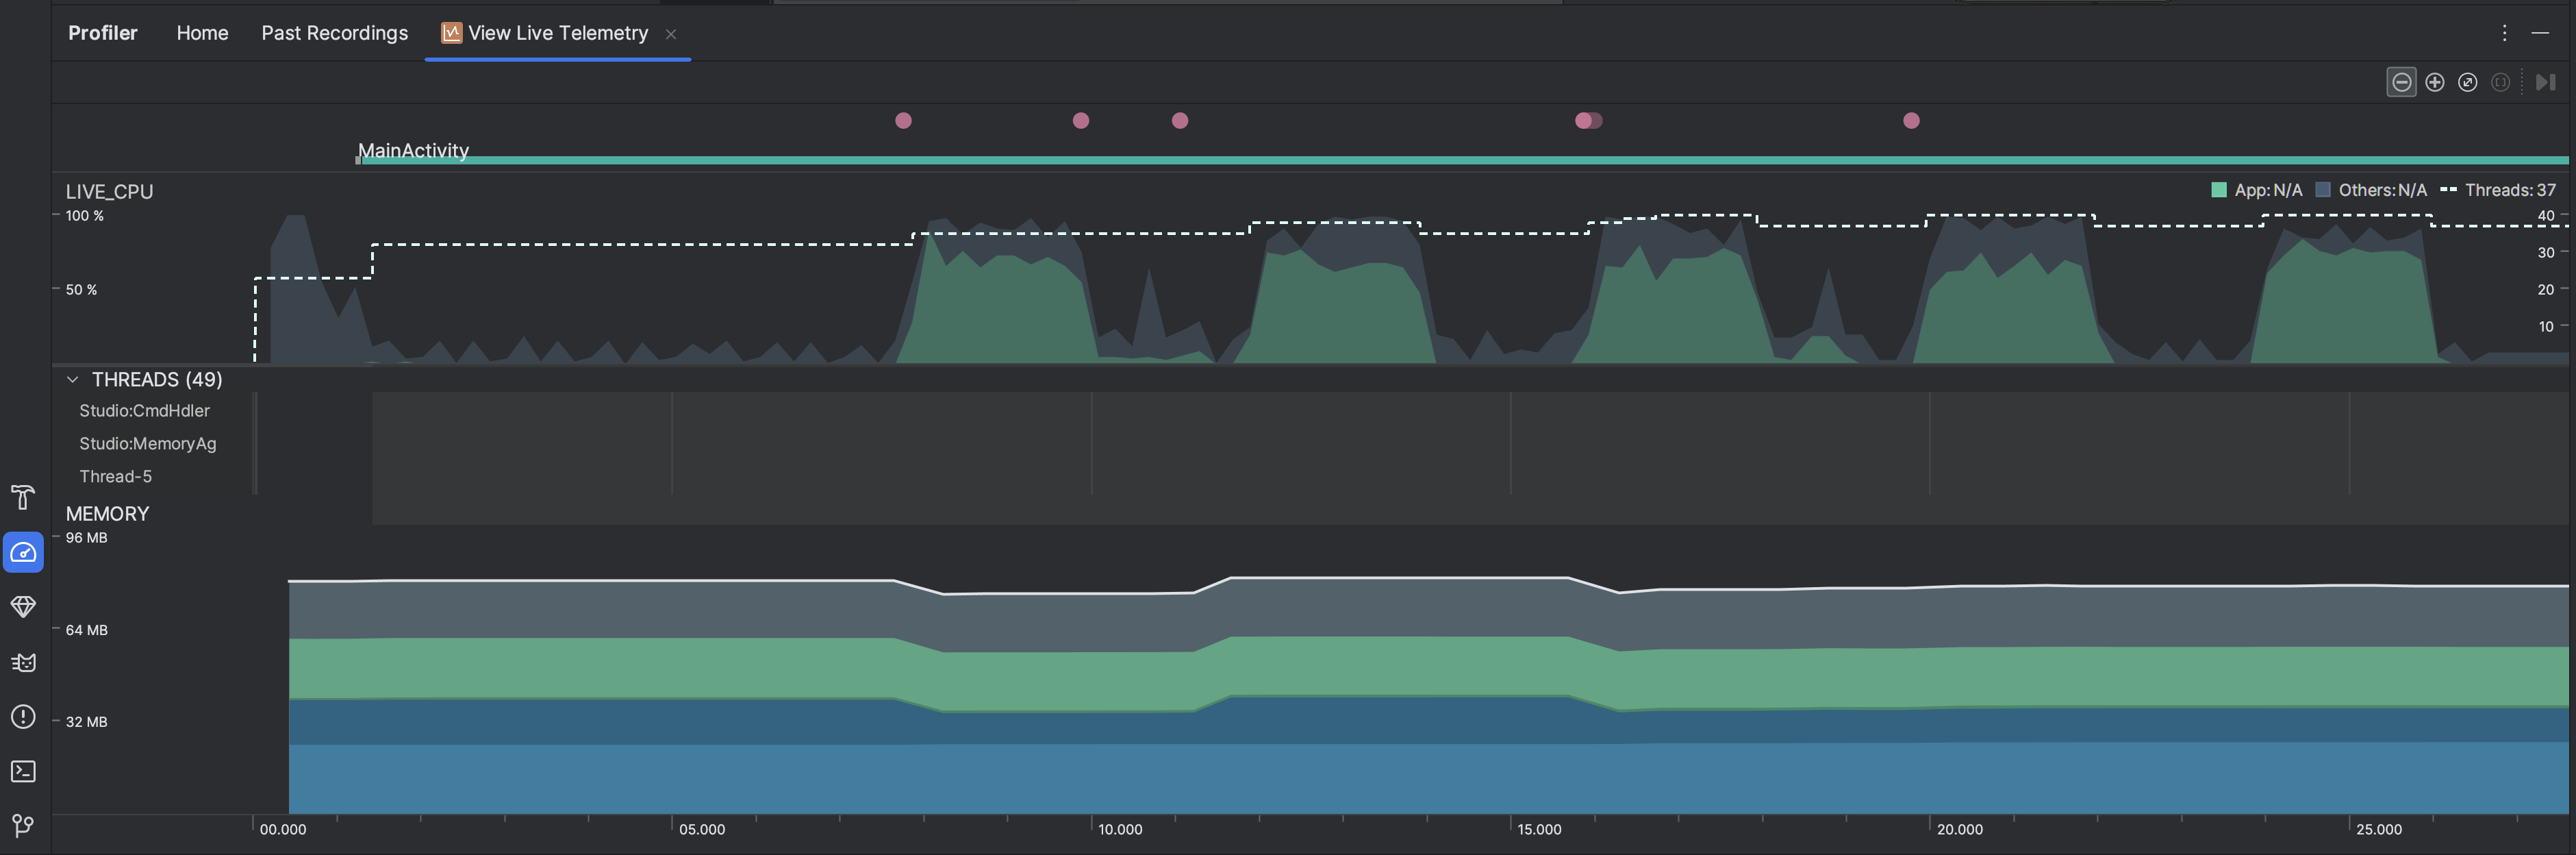
- Interazioni: mostra gli eventi di interazione dell'utente e del ciclo di vita dell'app lungo una cronologia
(richiede un processo dell'app debuggabile
e un dispositivo con livello API 26 o superiore).
- Utilizzo CPU: mostra l'utilizzo della CPU in tempo reale della tua app, come percentuale del tempo CPU totale disponibile, e il numero totale di thread utilizzati dalla tua app. La
cronologia mostra anche l'utilizzo della CPU di altri processi (ad esempio processi di sistema
o altre app), in modo da poterlo confrontare con l'utilizzo della tua app. Puoi esaminare
i dati storici sull'utilizzo della CPU spostando il mouse lungo l'asse orizzontale della
sequenza temporale.
- Thread: elenca ogni thread appartenente al processo dell'app e indica la sua
attività lungo una cronologia utilizzando i seguenti colori:
- Verde: il thread è attivo o pronto per utilizzare la CPU. ovvero in stato
di esecuzione o eseguibile.
- Giallo: il thread è attivo, ma è in attesa di un'operazione di I/O (ad esempio I/O disco o di rete) prima di poter completare il suo lavoro.
- Grigio: il thread è inattivo e non consuma tempo della CPU. A volte
si verifica quando il thread richiede l'accesso a una risorsa non
ancora disponibile. Il thread entra in sospensione volontaria oppure il kernel
lo mette in sospensione finché la risorsa richiesta non diventa disponibile.
- Il Profiler CPU segnala anche l'utilizzo della CPU dei thread che Android Studio e
la piattaforma Android aggiungono al processo dell'app, ad esempio
JDWP
, Profile
Saver
, Studio:VMStats
, Studio:Perfa
e Studio:Heartbeat
(anche se
i nomi esatti visualizzati nella sequenza temporale dell'attività dei thread potrebbero variare).
Android Studio riporta questi dati in modo che tu possa identificare quando l'attività dei thread e l'utilizzo della CPU sono effettivamente causati dal codice della tua app.
- Memoria: mostra un grafico a barre in pila che indica la quantità di memoria utilizzata da ciascuna categoria di memoria, come indicato dall'asse Y a sinistra e dalla legenda dei colori in alto.

I campioni di contenuti e codice in questa pagina sono soggetti alle licenze descritte nella Licenza per i contenuti. Java e OpenJDK sono marchi o marchi registrati di Oracle e/o delle sue società consociate.
Ultimo aggiornamento 2025-07-27 UTC.
[null,null,["Ultimo aggiornamento 2025-07-27 UTC."],[],[],null,["# Inspect your app live\n\nInspecting your app live gives you a high-level overview of the device's CPU\nusage, thread activity, and memory usage. If you don't know where to start with\nprofiling your app, use live view to conduct an exploratory analysis, and then\ndig deeper with the specific profiling tasks when you see behavior that can be\noptimized.\n\nTo start live view,\n[select the **View Live Telemetry** profiling task](/studio/profile#start-profiling).\nWhen the task starts, it starts displaying the following visualizations in real\ntime:\n\n- Interactions: Shows user interaction and app lifecycle events along a timeline (requires a [debuggable](/studio/profile#profileable-v-debuggable) app process and a device running API level 26 or higher).\n- CPU usage: Shows real-time CPU usage of your app---as a percentage of total available CPU time---and the total number of threads your app is using. The timeline also shows the CPU usage of other processes (such as system processes or other apps), so you can compare it to your app's usage. You can inspect historical CPU usage data by moving your mouse along the horizontal axis of the timeline.\n- Threads: Lists each thread that belongs to your app process and indicates its activity along a timeline using the following colors:\n - Green: The thread is active or is ready to use the CPU. That is, it's in a running or runnable state.\n - Yellow: The thread is active, but it's waiting on an I/O operation (for example, disk or network I/O) before it can complete its work.\n - Gray: The thread is sleeping and is not consuming any CPU time. This sometimes occurs when the thread requires access to a resource that is not yet available. Either the thread goes into voluntary sleep, or the kernel puts the thread to sleep until the required resource becomes available.\n - The CPU Profiler also reports CPU usage of threads that Android Studio and the Android platform add to your app process---such as `JDWP`, `Profile\n Saver`, `Studio:VMStats`, `Studio:Perfa`, and `Studio:Heartbeat` (although, the exact names displayed in the thread activity timeline might vary). Android Studio reports this data so that you can identify when thread activity and CPU usage are actually caused by your app's code.\n- Memory: Shows a stacked graph of how much memory is being used by each memory category, as indicated by the y-axis on the left and the color key at the top."]]