在線上檢查應用程式
透過集合功能整理內容
你可以依據偏好儲存及分類內容。
檢查應用程式的即時狀態,可概略瞭解裝置的 CPU 使用率、執行緒活動和記憶體用量。如果您不知道該從何著手剖析應用程式,請使用即時檢視畫面進行探索性分析,然後在發現可最佳化的行為時,深入瞭解特定剖析工作。
如要啟動即時檢視,請選取「View Live Telemetry」剖析工作。工作開始後,系統會即時顯示下列視覺化內容:
- 互動:顯示時間軸中的使用者互動和應用程式生命週期中大小事件 (需要可偵錯的應用程式程序,以及搭載 API 級別 26 以上的裝置)。
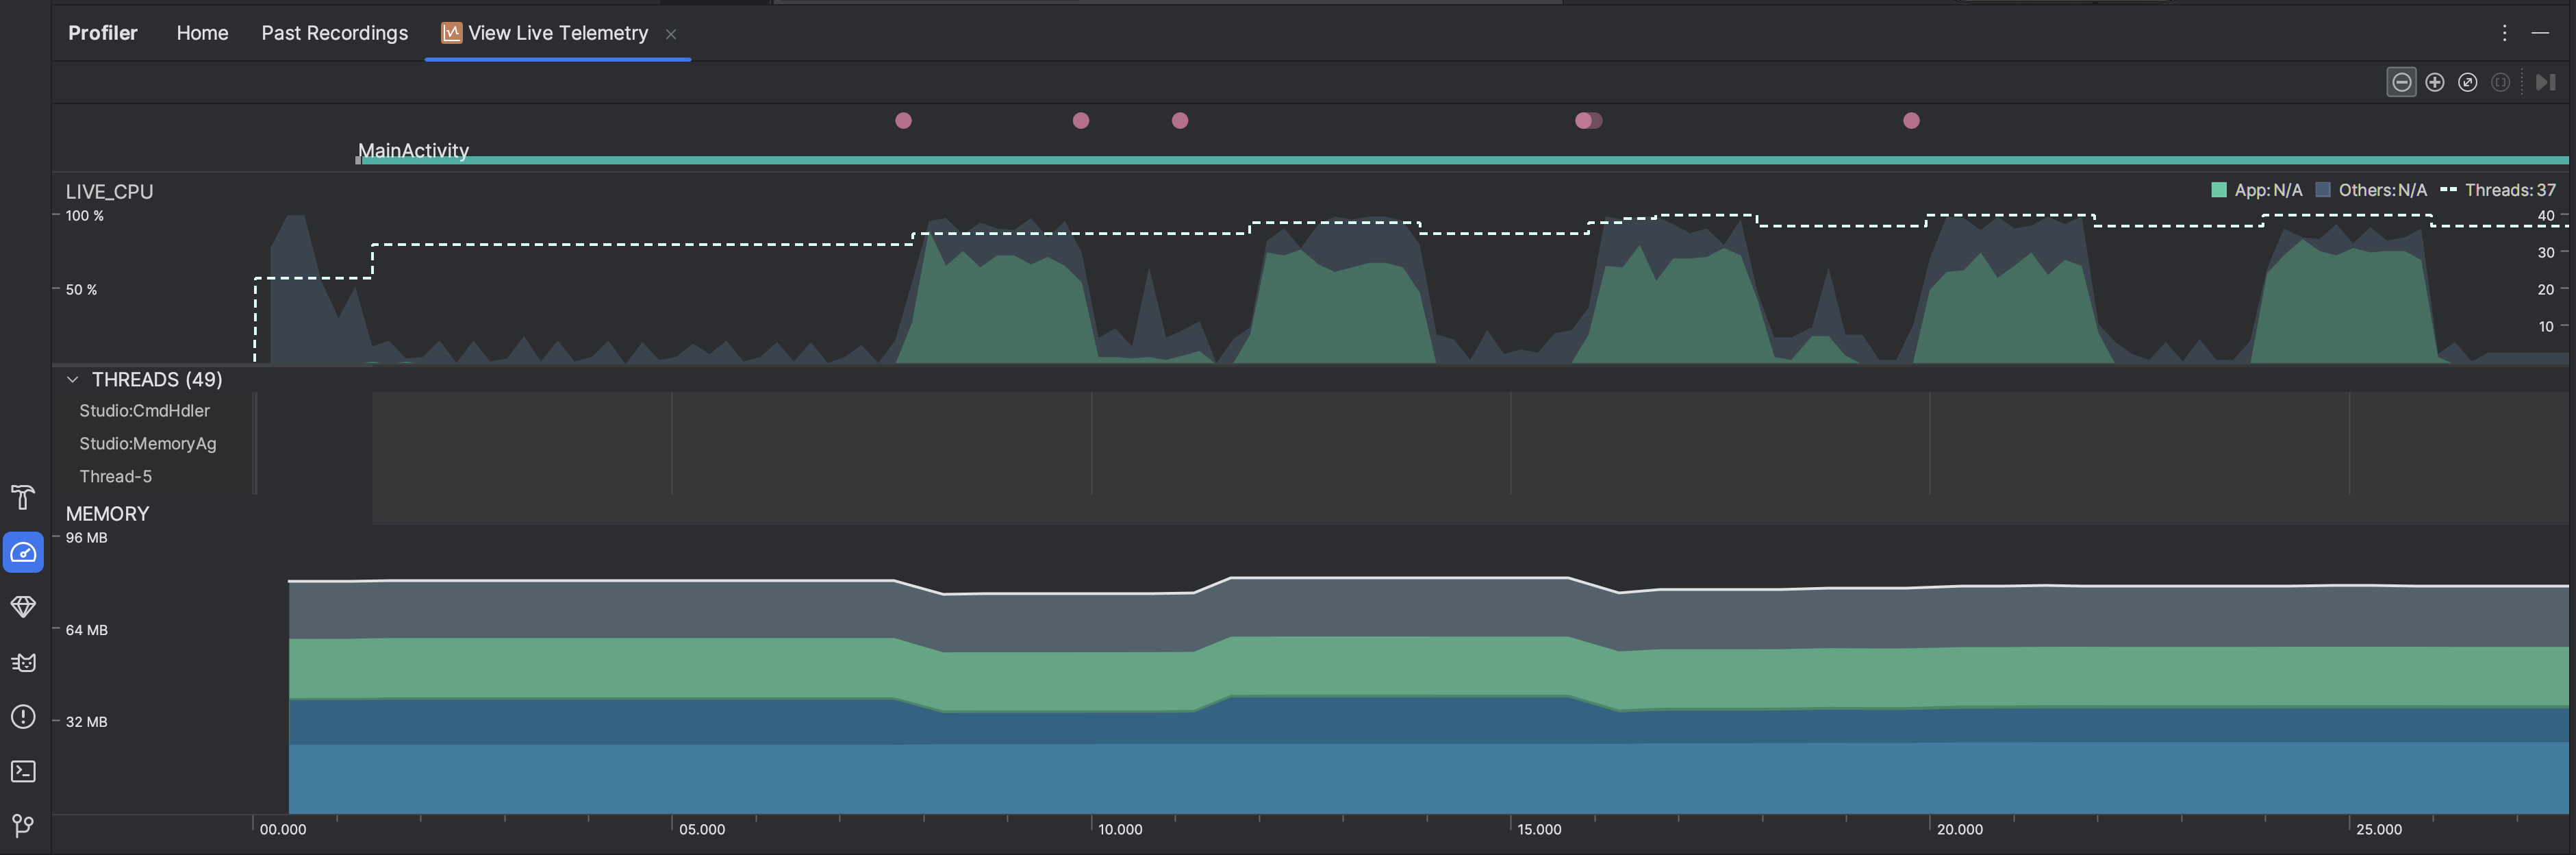
- CPU 使用率:顯示應用程式即時 CPU 使用率,以和總可用 CPU 時間之間的百分比呈現,以及應用程式正在使用的執行緒總數。時間軸也會顯示其他程序的 CPU (如系統程序或其他應用程式) 使用率,您可以跟自己的應用程式使用率進行比較。您可以把滑鼠沿著時間軸水平方向移動,即可檢視過往 CPU 使用率資料。
- 執行緒:列出每個屬於應用程式程序的執行緒,並以下列顏色顯示時間軸上的活動:
- 綠色:執行緒活躍中,或已可使用 CPU。也就是說,執行緒處於執行中或可執行的狀態。
- 黃色:執行緒已啟用,但正在等待 I/O 操作 (例如磁碟或網路 I/O) 完成,然後才能完成工作。
- 灰色:執行緒處於休眠狀態,未消耗任何 CPU 時間。當執行緒需要某資源的存取權,但尚未取得的時候,有時就會是這個狀態。執行緒可能是進入了自願休眠狀態,或是核心讓執行緒休眠,等到取得必要資源後才會使用。
- CPU 分析器也會回報執行緒的 CPU 使用率,其中應用程式程序 (如
JDWP
、Profile
Saver
、Studio:VMStats
、Studio:Perfa
及 Studio:Heartbeat
,不過執行緒活動時間軸上顯示的確切名稱可能會有不同) 會加上 Android Studio 和 Android 平台。Android Studio 會回報這類資料,以便您辨識應用程式的程式碼實際的執行緒活動和 CPU 使用率。
- 記憶體:堆疊長條圖,顯示每個記憶體類別目前的記憶體用量,以左側 y 軸和頂端的色彩索引鍵表示。

這個頁面中的內容和程式碼範例均受《內容授權》中的授權所規範。Java 與 OpenJDK 是 Oracle 和/或其關係企業的商標或註冊商標。
上次更新時間:2025-07-27 (世界標準時間)。
[null,null,["上次更新時間:2025-07-27 (世界標準時間)。"],[],[],null,["# Inspect your app live\n\nInspecting your app live gives you a high-level overview of the device's CPU\nusage, thread activity, and memory usage. If you don't know where to start with\nprofiling your app, use live view to conduct an exploratory analysis, and then\ndig deeper with the specific profiling tasks when you see behavior that can be\noptimized.\n\nTo start live view,\n[select the **View Live Telemetry** profiling task](/studio/profile#start-profiling).\nWhen the task starts, it starts displaying the following visualizations in real\ntime:\n\n- Interactions: Shows user interaction and app lifecycle events along a timeline (requires a [debuggable](/studio/profile#profileable-v-debuggable) app process and a device running API level 26 or higher).\n- CPU usage: Shows real-time CPU usage of your app---as a percentage of total available CPU time---and the total number of threads your app is using. The timeline also shows the CPU usage of other processes (such as system processes or other apps), so you can compare it to your app's usage. You can inspect historical CPU usage data by moving your mouse along the horizontal axis of the timeline.\n- Threads: Lists each thread that belongs to your app process and indicates its activity along a timeline using the following colors:\n - Green: The thread is active or is ready to use the CPU. That is, it's in a running or runnable state.\n - Yellow: The thread is active, but it's waiting on an I/O operation (for example, disk or network I/O) before it can complete its work.\n - Gray: The thread is sleeping and is not consuming any CPU time. This sometimes occurs when the thread requires access to a resource that is not yet available. Either the thread goes into voluntary sleep, or the kernel puts the thread to sleep until the required resource becomes available.\n - The CPU Profiler also reports CPU usage of threads that Android Studio and the Android platform add to your app process---such as `JDWP`, `Profile\n Saver`, `Studio:VMStats`, `Studio:Perfa`, and `Studio:Heartbeat` (although, the exact names displayed in the thread activity timeline might vary). Android Studio reports this data so that you can identify when thread activity and CPU usage are actually caused by your app's code.\n- Memory: Shows a stacked graph of how much memory is being used by each memory category, as indicated by the y-axis on the left and the color key at the top."]]