
Network Inspector 会在时间轴上显示实时网络活动,包括发送和接收的数据。Network Inspector 便于您检查应用传输数据的方式和时间,并适当优化底层代码。
如需打开 Network Inspector,请按以下步骤操作:
- 在 Android Studio 导航栏中,依次选择 View > Tool Windows > App Inspection。在应用检查窗口自动连接到应用进程后,从标签页中选择 Network Inspector。
- 如果应用检查窗口未自动连接应用进程,您可能需要手动选择应用进程。
- 从 App Inspection 窗口中,选择您要检查的设备和应用进程。
Network Inspector 概览
Network Inspector 窗口顶部显示的是事件时间轴。点击并拖动时间轴,以选择时间轴的一部分并检查该时段的网络流量。
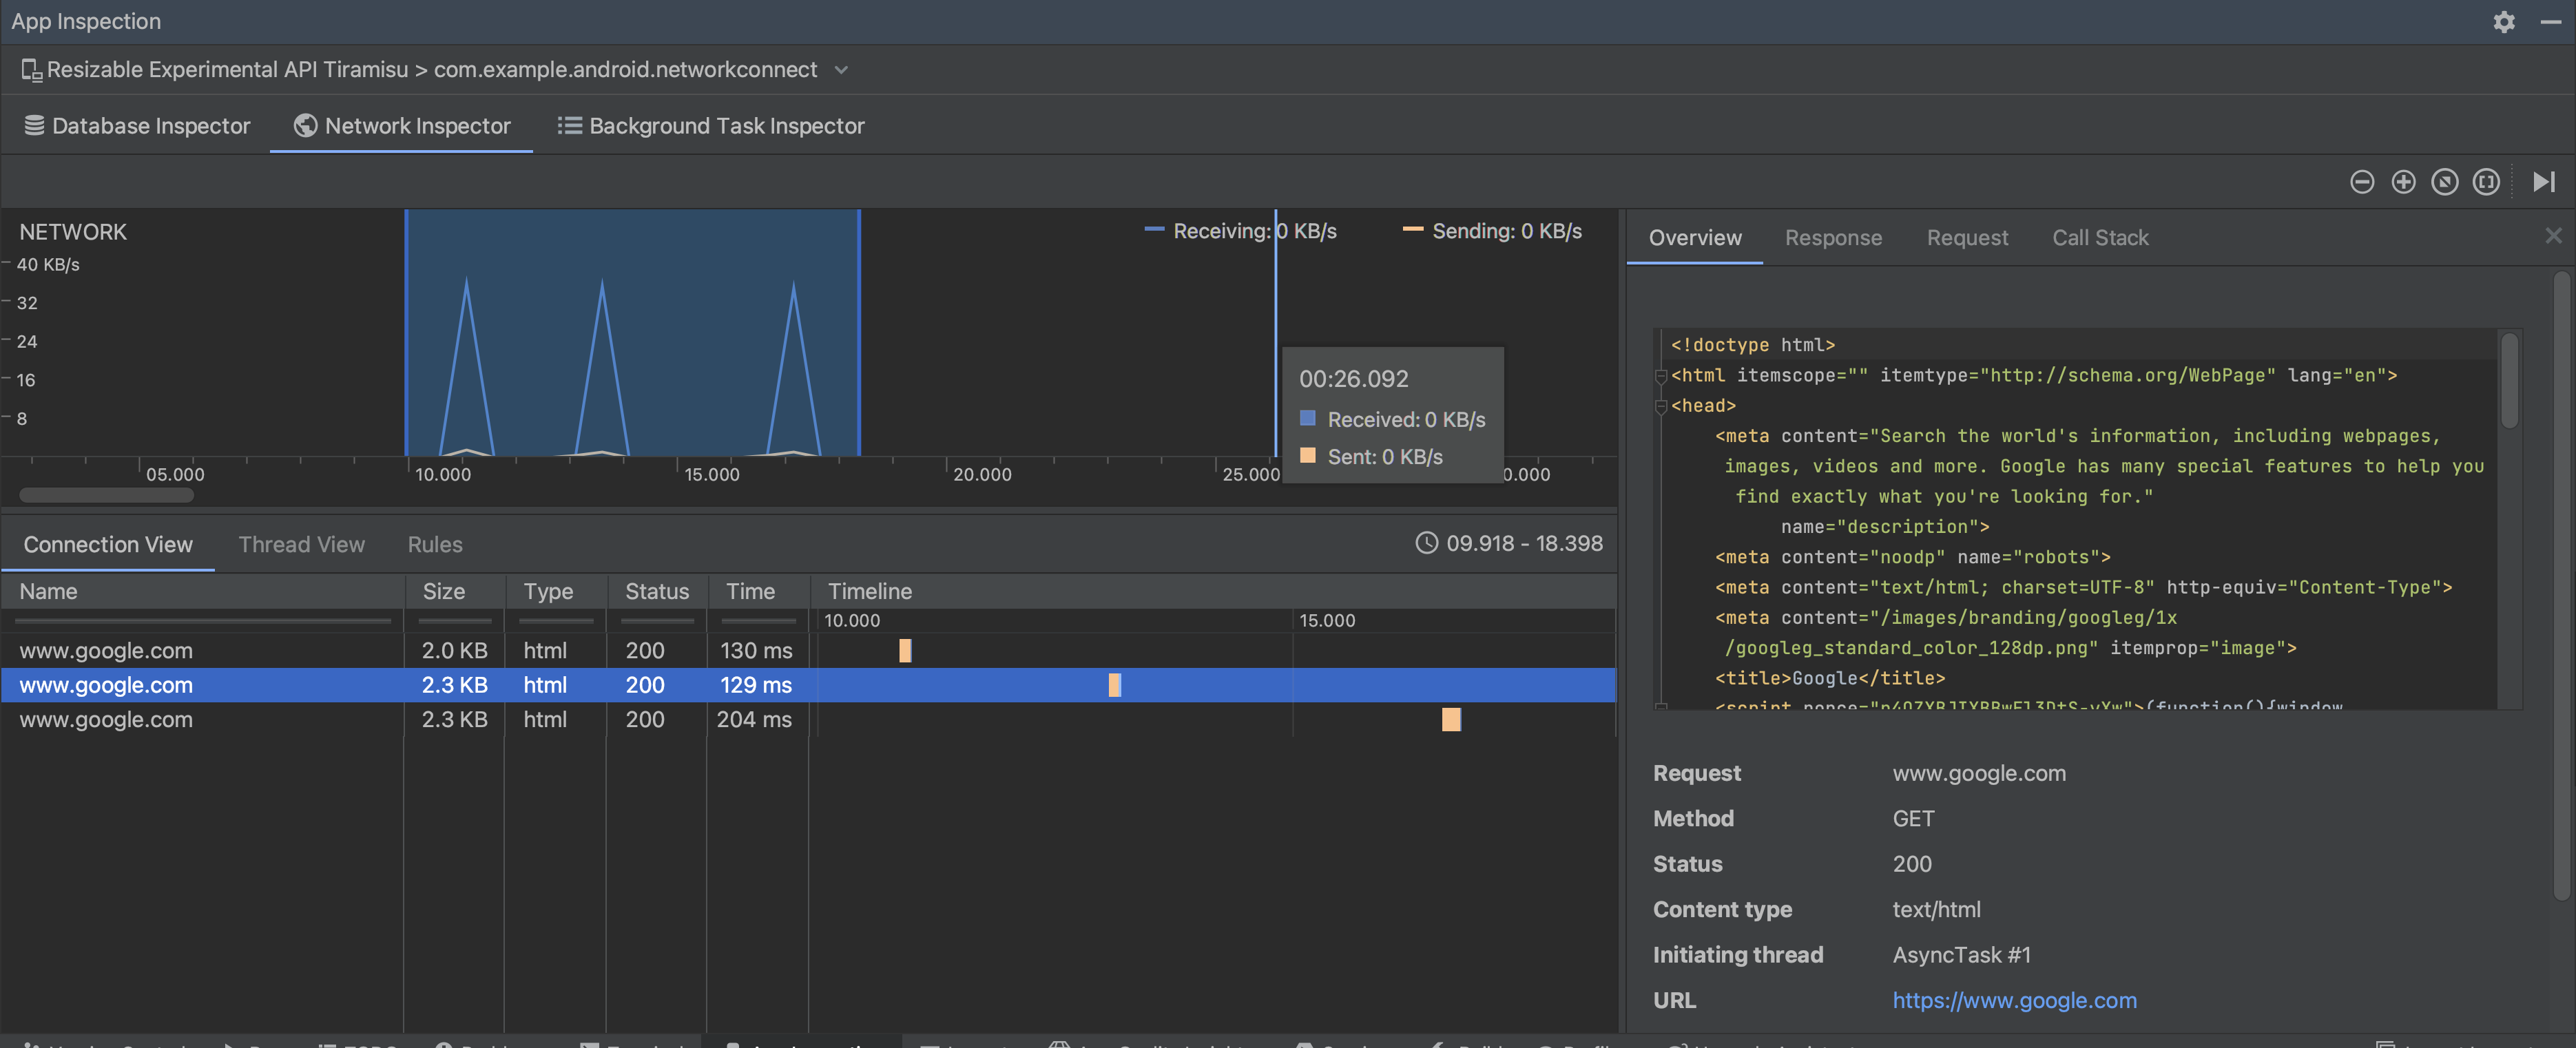
在“详细信息”窗格中,时间图表可帮助您识别哪些地方可能发生性能问题。黄色部分的开头对应所发送请求的第一个字节。蓝色部分的开头对应所收到响应的第一个字节。蓝色部分的末尾对应所收到响应的最后一个字节。
在时间轴下方的窗格中,您可以选择以下某个标签页,以详细了解时间轴上选定时段内的网络活动:
- Connection View:列出了在时间轴上选定时段内从您应用的所有 CPU 线程发送或接收的文件。对于每个请求,您可以检查大小、类型、状态和传输时长。您可以通过点击任意列标题来对此列表排序。您还可看到时间轴上选定时段的明细数据,从而了解每个文件的发送或接收时间。
Thread View:显示应用的每个 CPU 线程的网络活动。如图 2 所示,您可以在此视图中检查各网络请求由哪些线程负责。
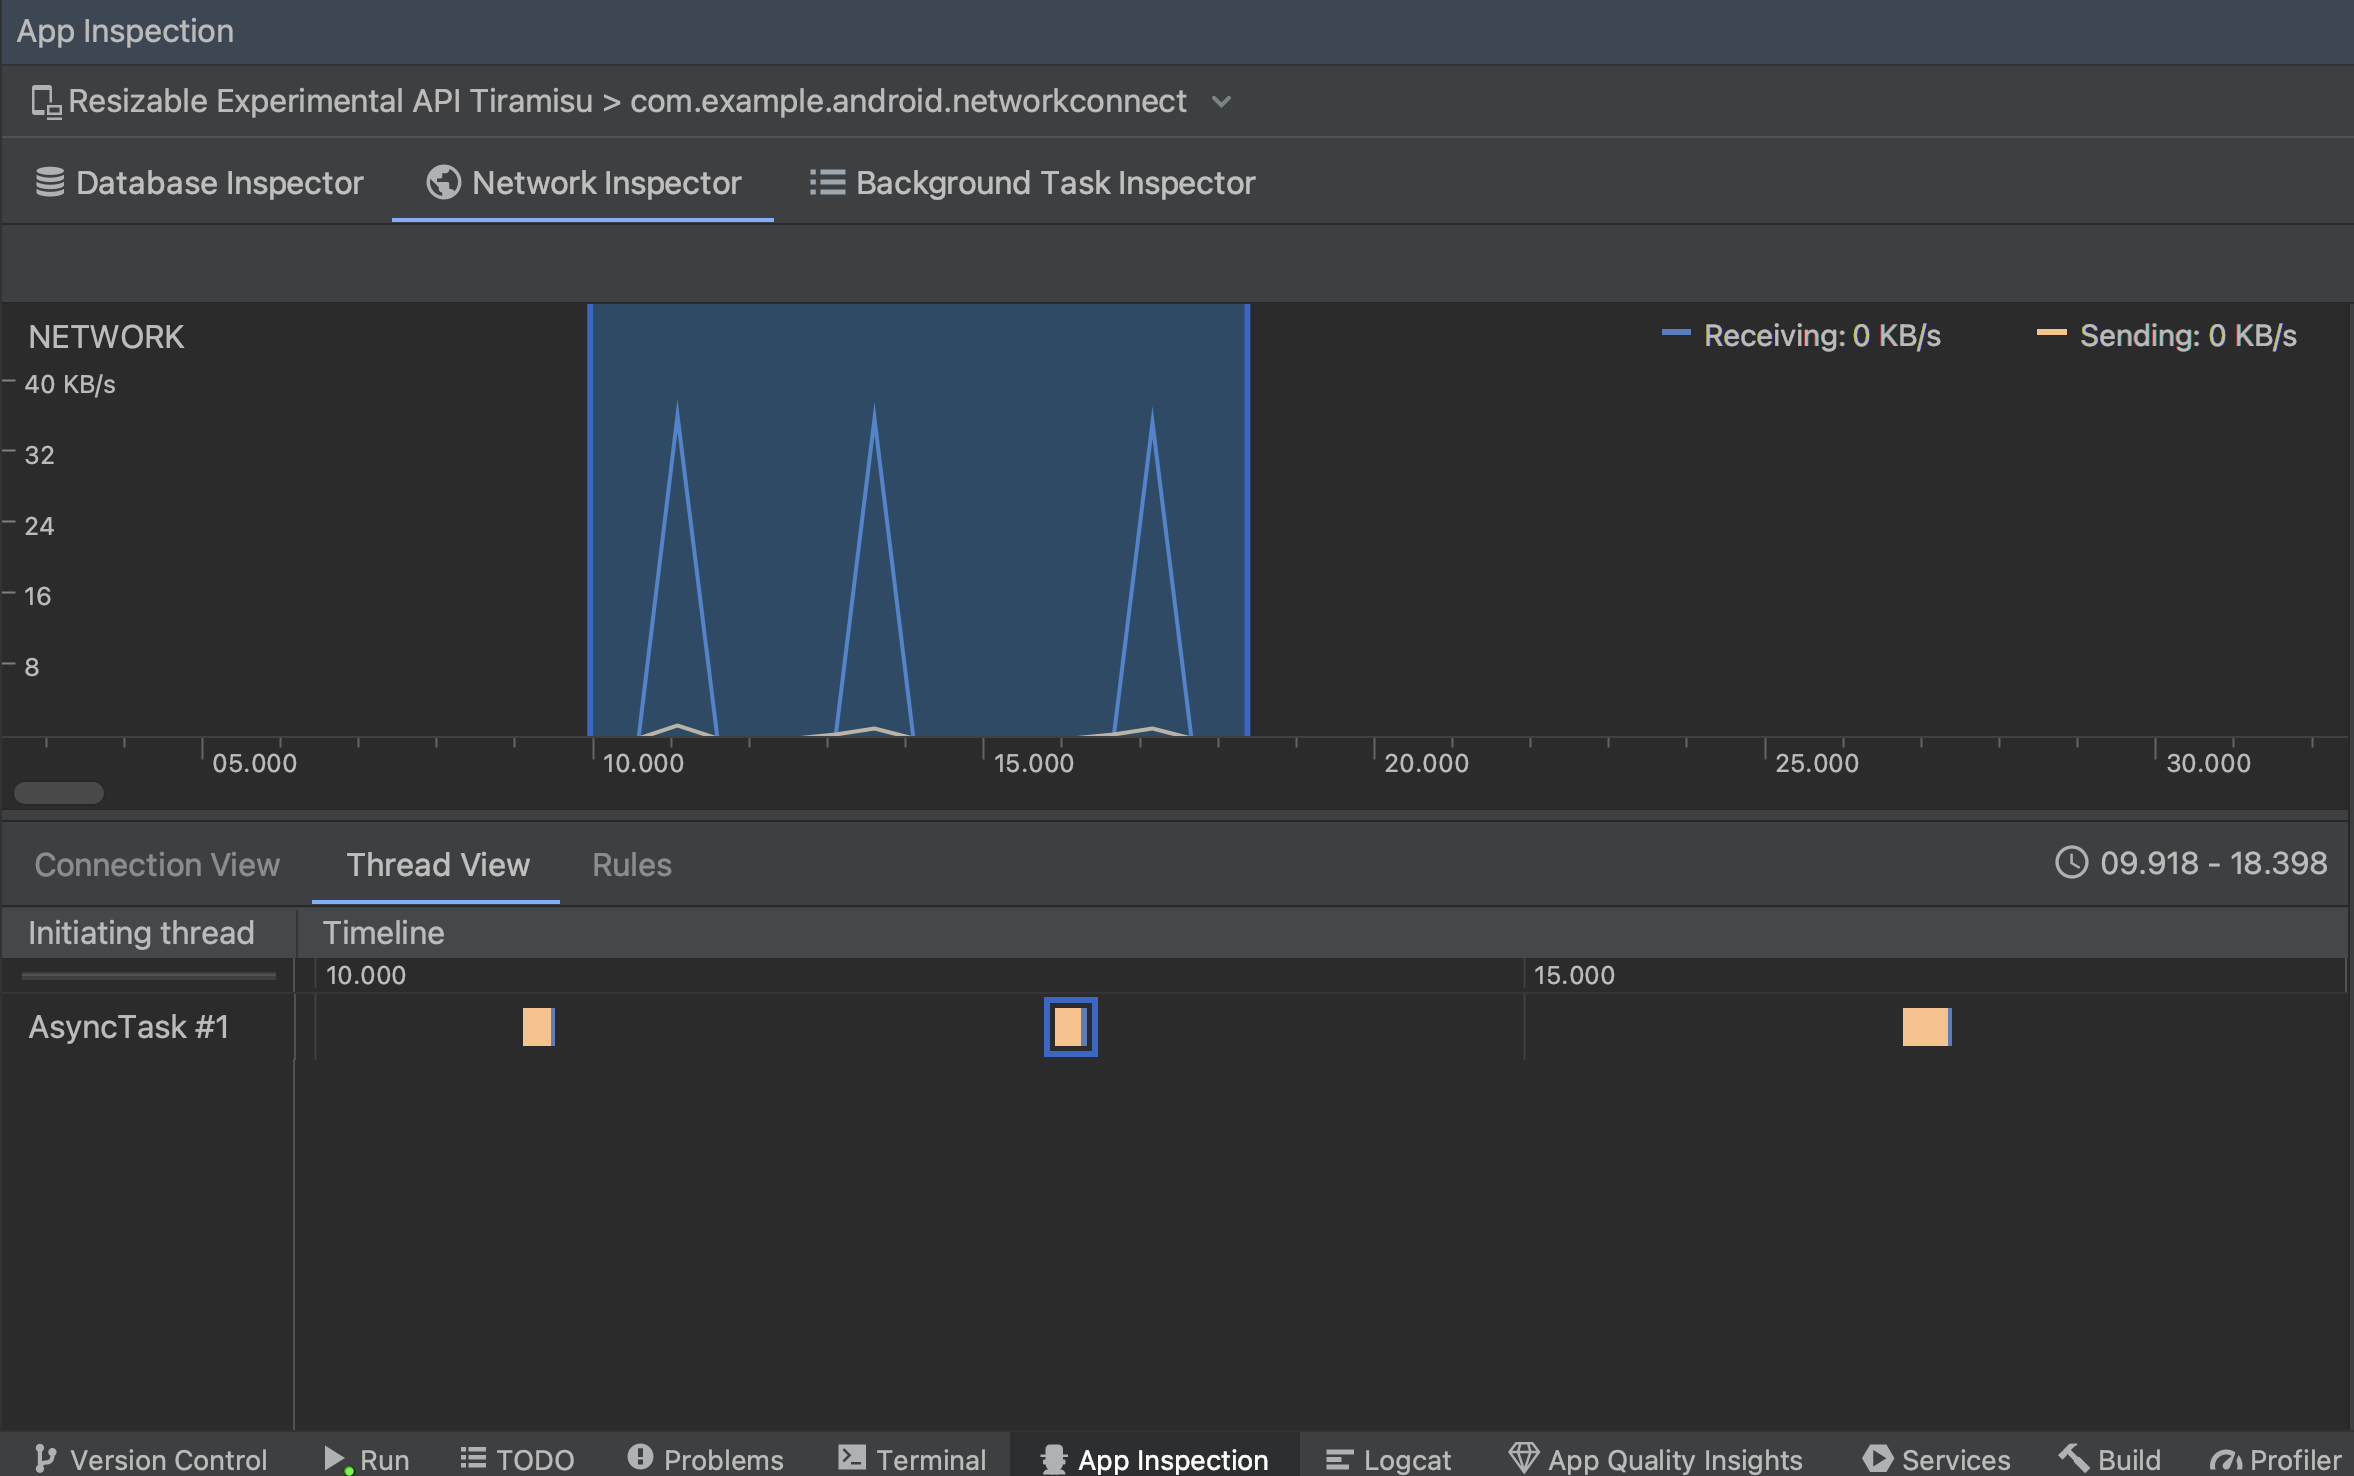
图 2. 在 Thread View 中检查应用线程的网络请求。 Rules View:Rules 有助于测试应用在遇到不同状态代码、标头和正文等响应时的行为方式。创建新规则时,为新规则命名,并在 Origin 子部分下添加要拦截的响应的来源信息。在 Response 子部分中,您可以指定修改响应的位置和方式。例如,您可以将规则设置为对具有特定状态代码的响应执行规则并修改相应状态代码。在 Header rules 和 Body rules 子部分,您可以创建子规则,用于添加或修改响应标头或正文。系统会按照表中列出的顺序应用规则。您可以通过勾选各条规则旁边的 Active 复选框来选择要启用或停用的规则。
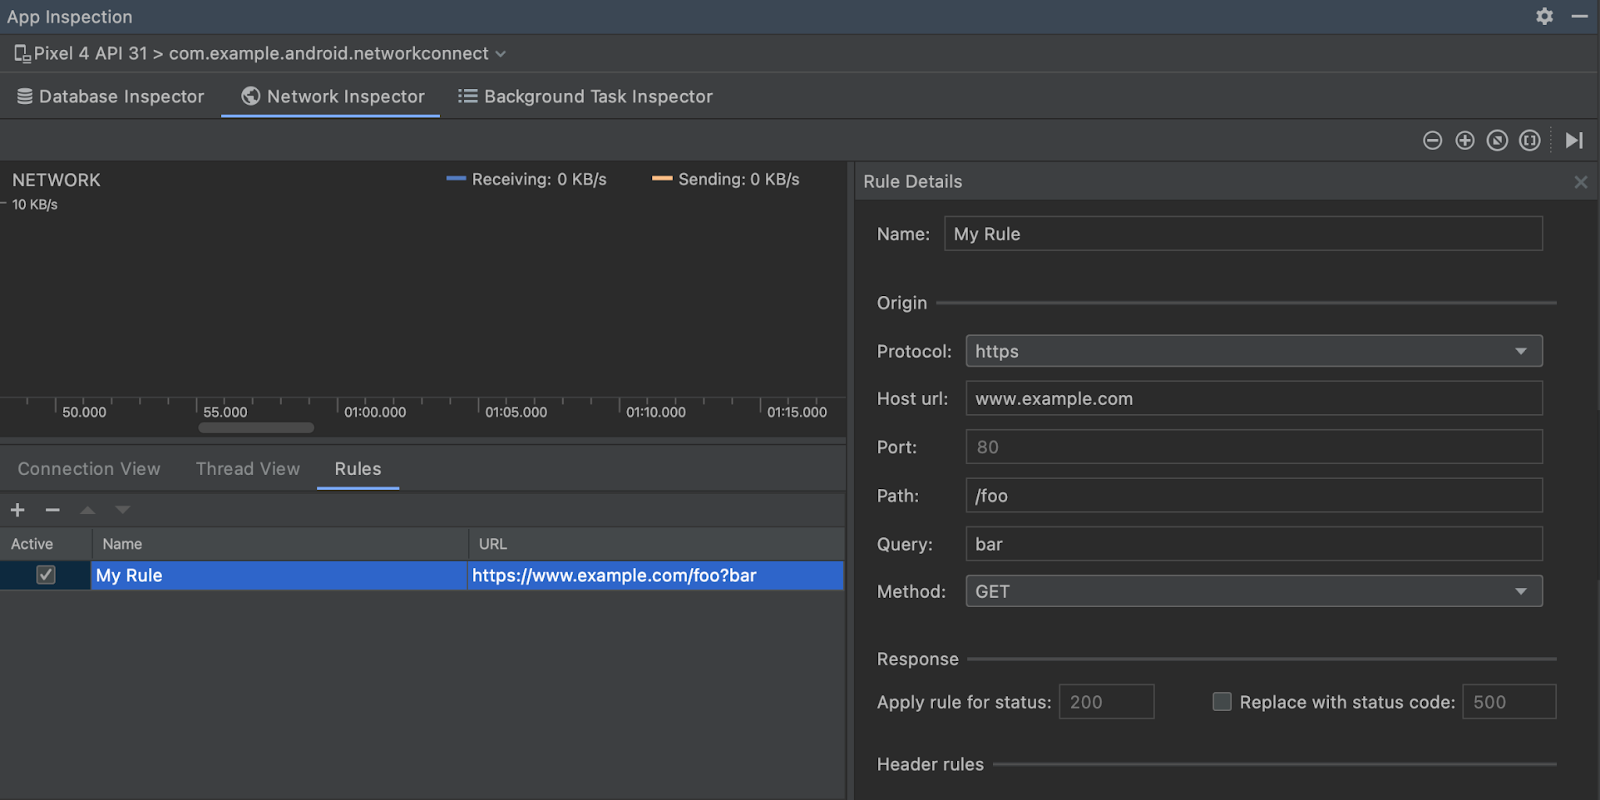
图 3. Network Inspector 中的 Rules 和 Rule Details 窗格。
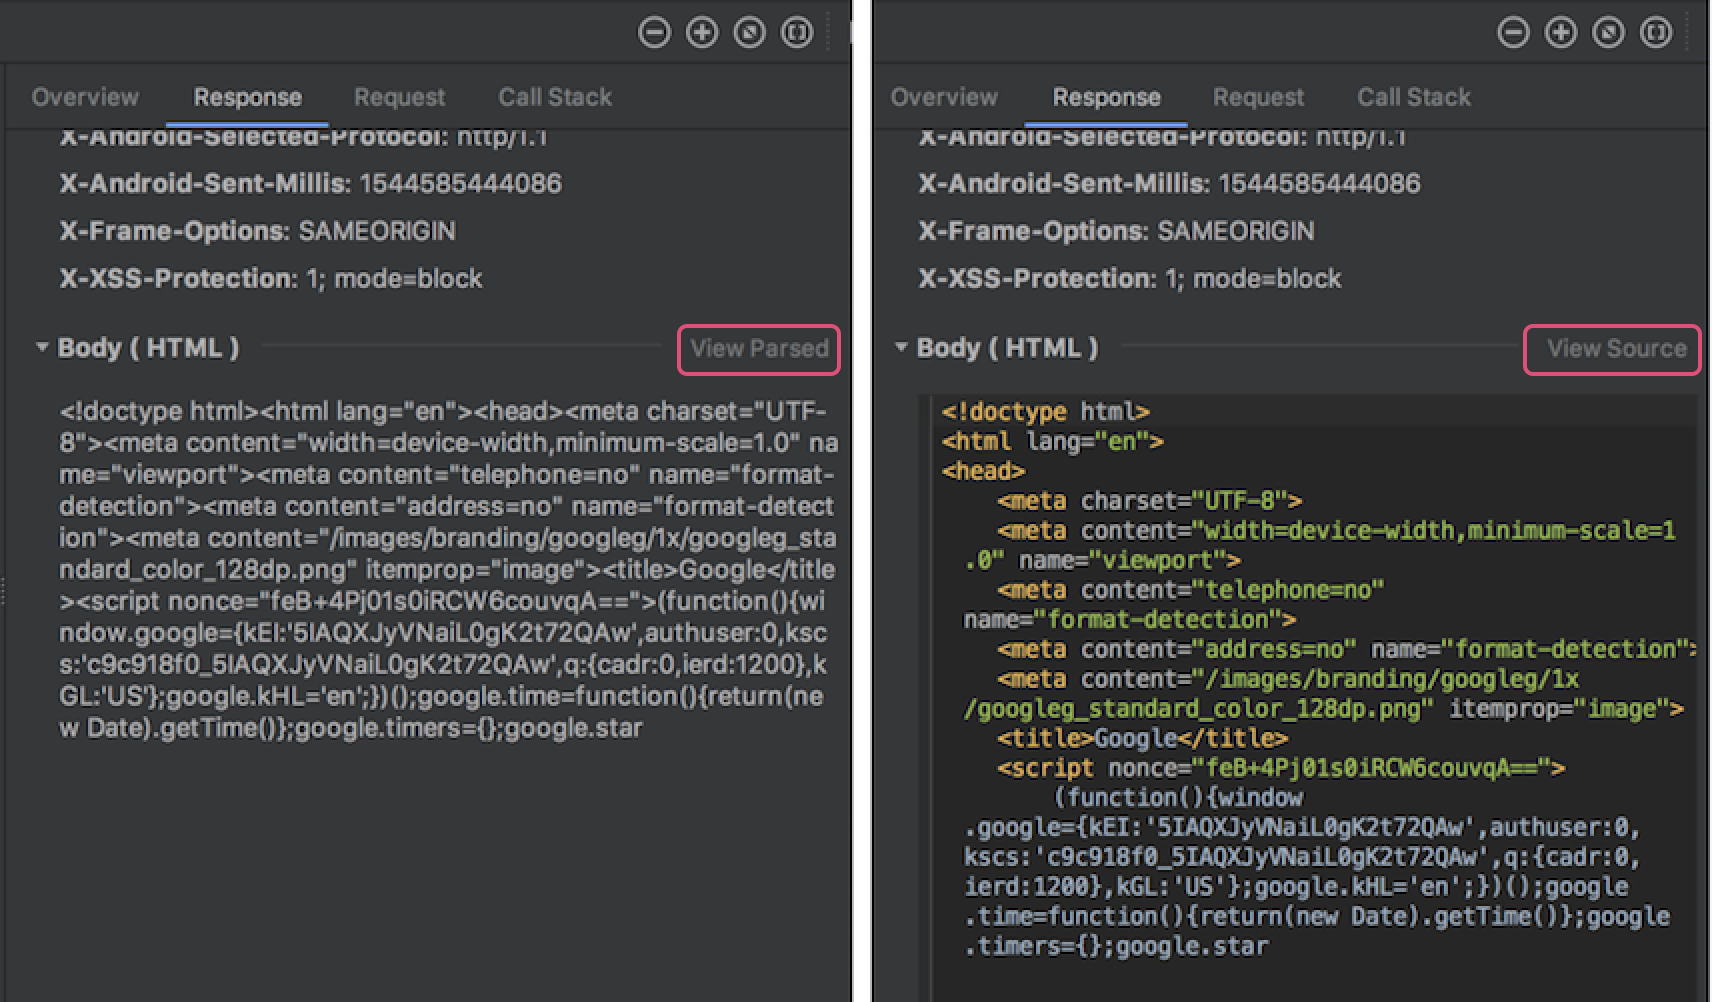
从 Connection View 或 Thread View 中点击请求名称,可检查有关已发送或已接收数据的详细信息。点击各个标签页可查看响应标头和正文、请求标头和正文或调用堆栈。
在 Response 和 Request 标签页中,点击 View Parsed 链接可显示格式化文本,点击 View Source 链接可显示原始文本。
除了显示 HttpsURLConnection 的网络请求外,Network Inspector 还支持 OkHttp。某些第三方网络库(如 Retrofit)在内部使用 OkHttp,因此 Network Inspector 可让您检查其网络活动。通过
Now In Android 示例应用
使用 OkHttp 进行网络操作,因此适合在
操作。
如果您使用的是 HttpsURLConnection API,则仅会在 Request 标签页中看到使用 setRequestProperty 方法添加到您代码中的标头,如以下示例所示:
Kotlin
val url = URL(MY_URL_EN)
val urlConnection: HttpsURLConnection = url.openConnection() as HttpsURLConnection
...
// Sets acceptable encodings in the request header.
urlConnection.setRequestProperty("Accept-Encoding", "identity")
Java
URL url = new URL(MY_URL_EN);
HttpsURLConnection urlConnection = (HttpsURLConnection) url.openConnection();
//...
// Sets acceptable encodings in the request header.
urlConnection.setRequestProperty("Accept-Encoding", "identity");
排查网络连接问题
如果 Network Inspector 检测到流量值,但无法识别任何受支持的网络请求,您会收到以下错误消息:
**Network Inspector Data Unavailable:** There is no information for the
  network traffic you've selected.
目前,Network Inspector 仅支持 HttpsURLConnection 和 OkHttp 网络连接库。如果您的应用使用的是其他网络连接库,您可能无法在 Network Inspector 中查看网络活动。如果您收到了这条错误消息,但您的应用使用的确实是 HttpsURLConnection 或 OkHttp,请报告 bug 或在问题跟踪器中进行搜索,并在与您的问题有关的现有报告中加入您的反馈。您还可以使用这些资源来请求对其他库的支持。