
Recording the Java/Kotlin methods called during your app's code execution lets you see the callstack and CPU usage at a given time. This data is useful for identifying sections of code that take a long time or a lot of system resources to execute. If you want a full view of the callstack including native call frames, use the callstack sample profiling task.
When recording Java or Kotlin methods, the Android Studio Profiler uses runtime instrumentation to inject timestamps at the entry and exit points of each method call. The profiler then aggregates and analyzes these timestamps to generate precise method tracing data and execution timings. Use method recording when you need exact visibility into specific method invocations. We recommend limiting recordings to five seconds or less to avoid performance overhead from runtime instrumentation.
Java/Kotlin methods overview
After you run the Find CPU Hotspots task the Android Studio Profiler provides the following information:
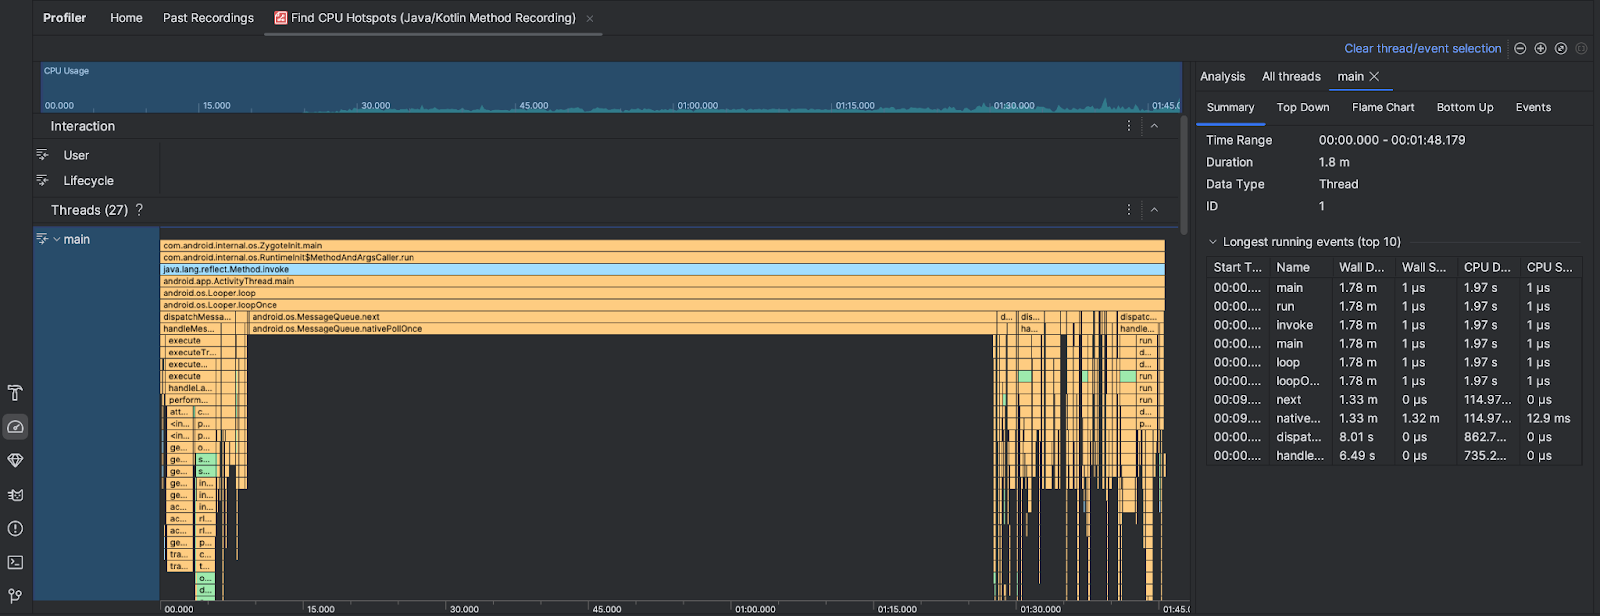
- CPU Usage: Shows CPU usage of your app as a percentage of total available CPU capacity by time. Note that the CPU usage includes not only Java/Kotlin methods but also native code. Highlight a section of the timeline to filter to the details for that time period.
- Interactions: Shows user interaction and app lifecycle events along a timeline.
- Threads: Shows the threads that your app runs on. In most cases, you'll want to first focus on the topmost thread that represents your app.
To identify the methods or call stacks that take the most time, use the flame chart or top down chart.