
本页介绍了如何在 Perfetto 界面中检索和直观呈现轨迹。
检索轨迹
记录配置文件后,轨迹会保存在您的设备上。在分析这些轨迹之前,您必须先检索它们。
轨迹位置信息由 ProfilingResult.getResultFilePath() 提供。如需了解如何获取轨迹位置,请参阅如何捕获性能剖析文件。获得轨迹的位置后,您可以将轨迹上传到服务器。
本地测试:使用 ADB 检索轨迹
使用 adb 获取轨迹有助于检查性能和在本地进行调试。
已遮盖的轨迹会保存在您设备的文件中。已保存配置文件的典型路径为:
/data/user/0/<app>/files/profiling/profile_<tag>_<datetime>.perfetto-trace
其中:
<app>是应用名称。<datetime>是轨迹的采集日期和时间。<tag>是使用setTag配置的用户提供的标记
如果未经过编辑的轨迹已启用并保存,请使用以下 adb 命令从设备中提取这些轨迹:
adb pull
/data/misc/perfetto-traces/profiling/<trace-name>.perfetto-trace-unredacted
直观呈现轨迹
将轨迹检索到计算机后,您就可以在 Perfetto 界面中查看它。
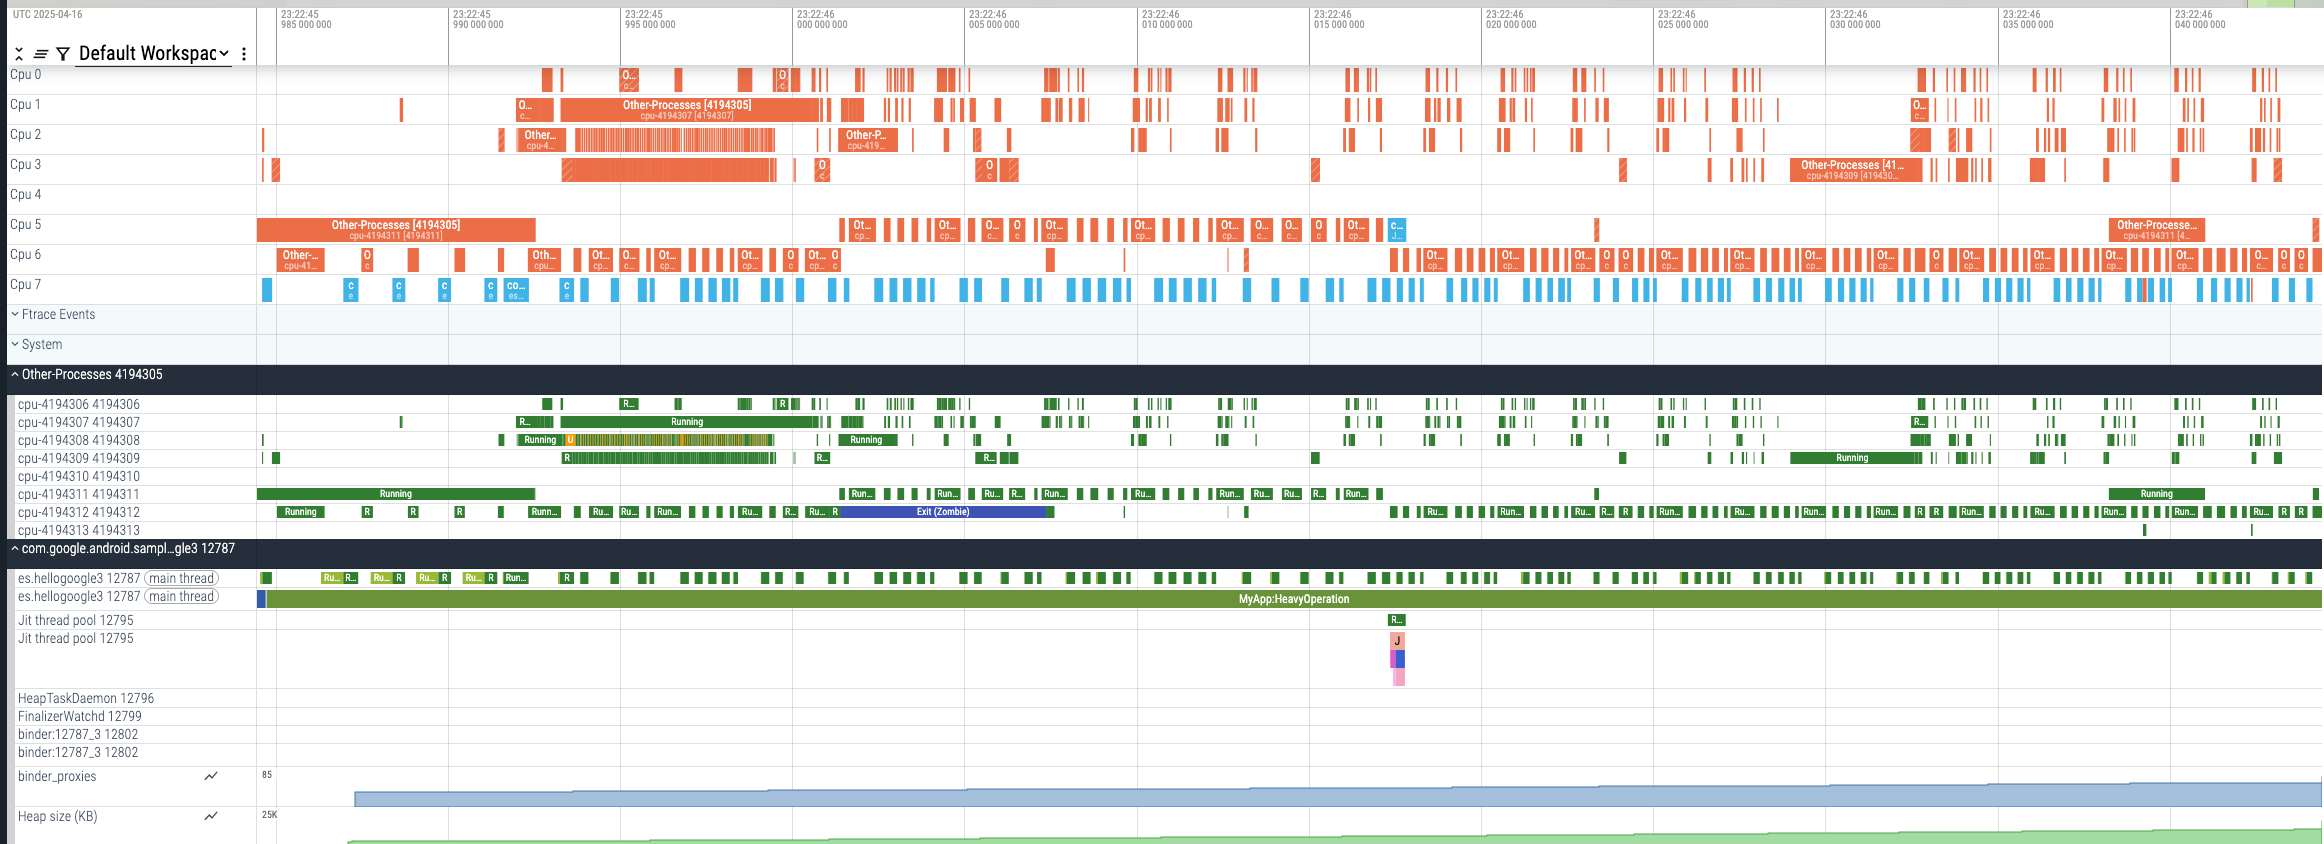
在经过脱敏处理的轨迹中,OtherProcesses 部分会合并来自其他进程的所有 CPU 活动。合并进程可确保这些其他进程所做的事情不会泄露。
不过,查看此组合 CPU 活动仍可让您检查系统在录制期间是否过载。检查系统活动有助于您确定应用运行缓慢是由于内部问题还是系统整体运行缓慢。
下图突出显示并简要介绍了您将在轨迹中看到的主要部分:
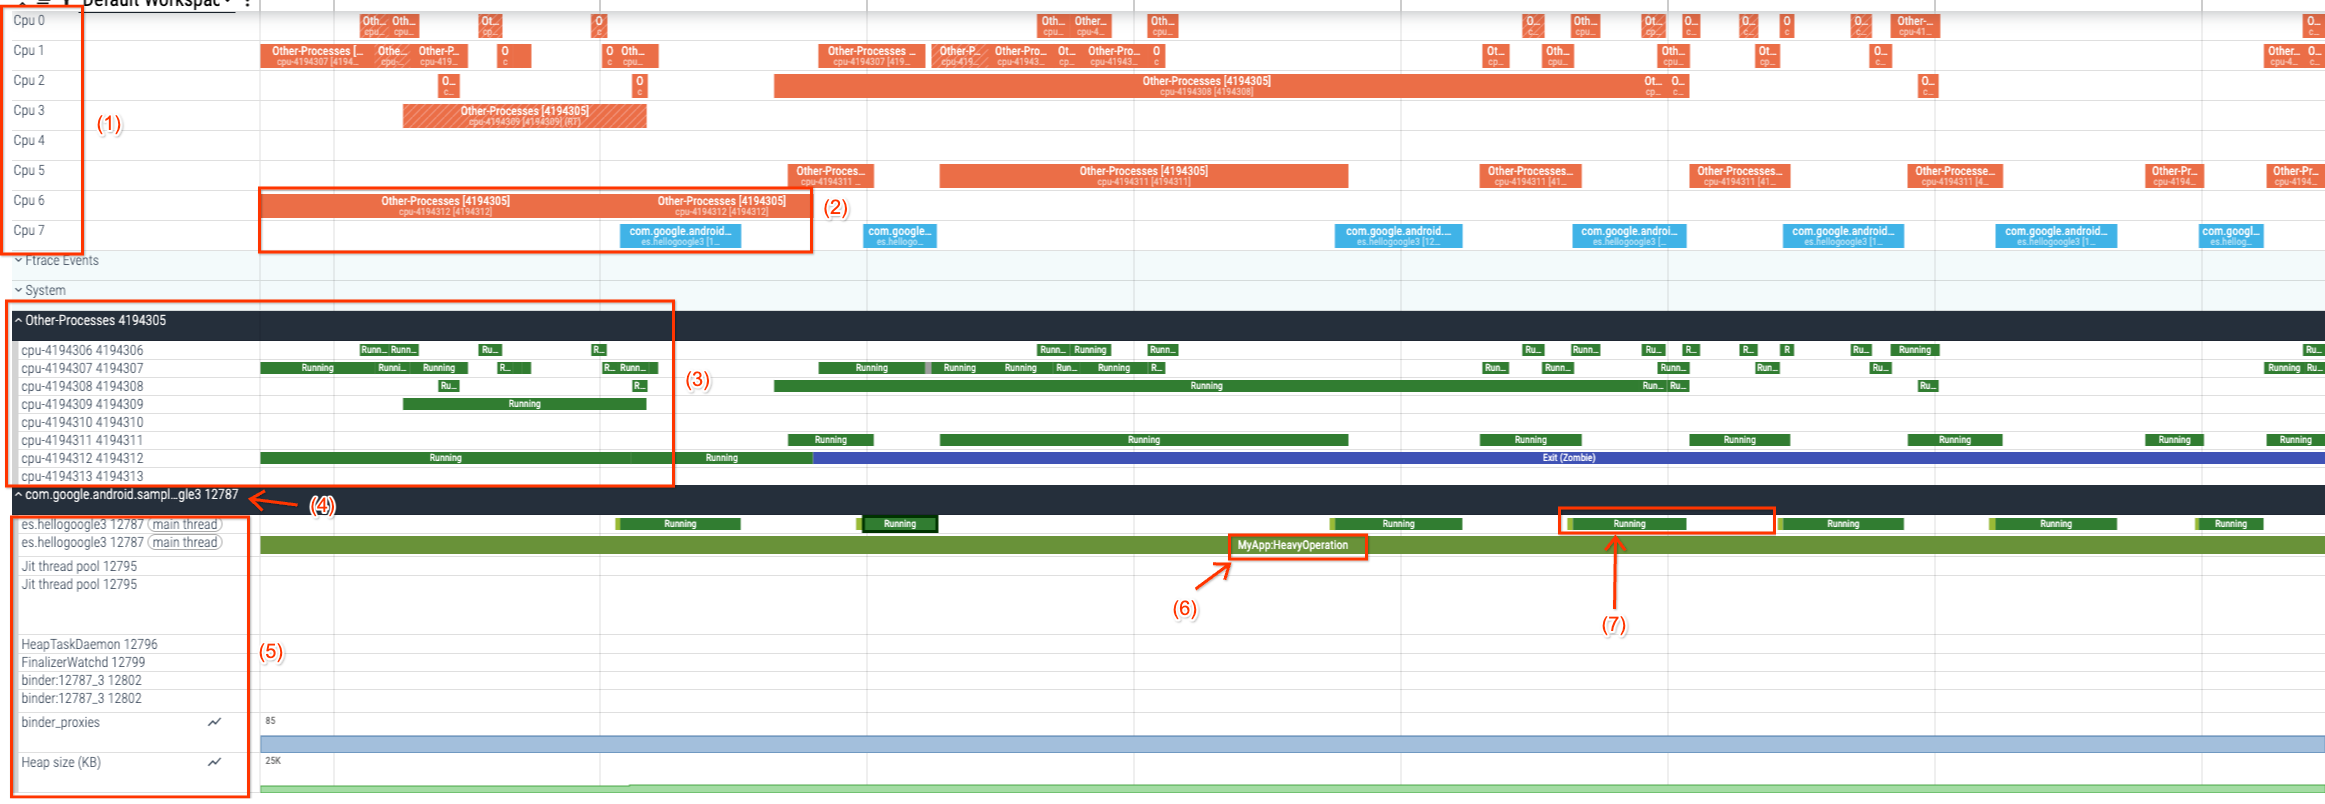
- CPU 列表:显示设备上的所有可用处理器。
- CPU 任务:显示每个 CPU 正在执行哪些线程。
- 其他进程视图:显示其他进程消耗的 CPU 资源。
- Process View:显示应用进程。
- “Threads”视图:显示进程内运行的线程及其线程状态(可运行 [R]、正在运行 [R]、休眠 [S]、不可中断的休眠 [D]),这些状态直接映射到 Linux 进程状态。
- 轨迹切片:此部分显示应用开发者或框架添加的轨迹注释。这些注释涵盖了
Trace.beginSection和Trace.endSection之间的计算。
如需详细了解 Perfetto 界面和轨迹可视化,请参阅 Perfetto 文档。