
Memory issues often involve multiple components across the entire system. Understanding how the kernel manages memory and how processes compete for resources is key to resolving complex issues.
Perfetto for system analysis
Perfetto is the primary tool for system-wide analysis. It allows you to record a trace that includes:
- Process Memory Counters:
rss.anon,rss.file, andswapfor every process. - Kernel Stats: Information from
/proc/vmstatand/proc/meminfo. - PSI (Pressure Stall Information): Detailed metrics on how much processes are stalled due to memory pressure.
- LMK Events: When and why the Low Memory Killer decided to terminate a process.
- Scheduling: Correlate memory reclaim activity (
kswapd) with CPU usage.
Memory counters in Perfetto
When viewing a trace, expand a process's track group and scroll towards the bottom to see various virtual memory counters.
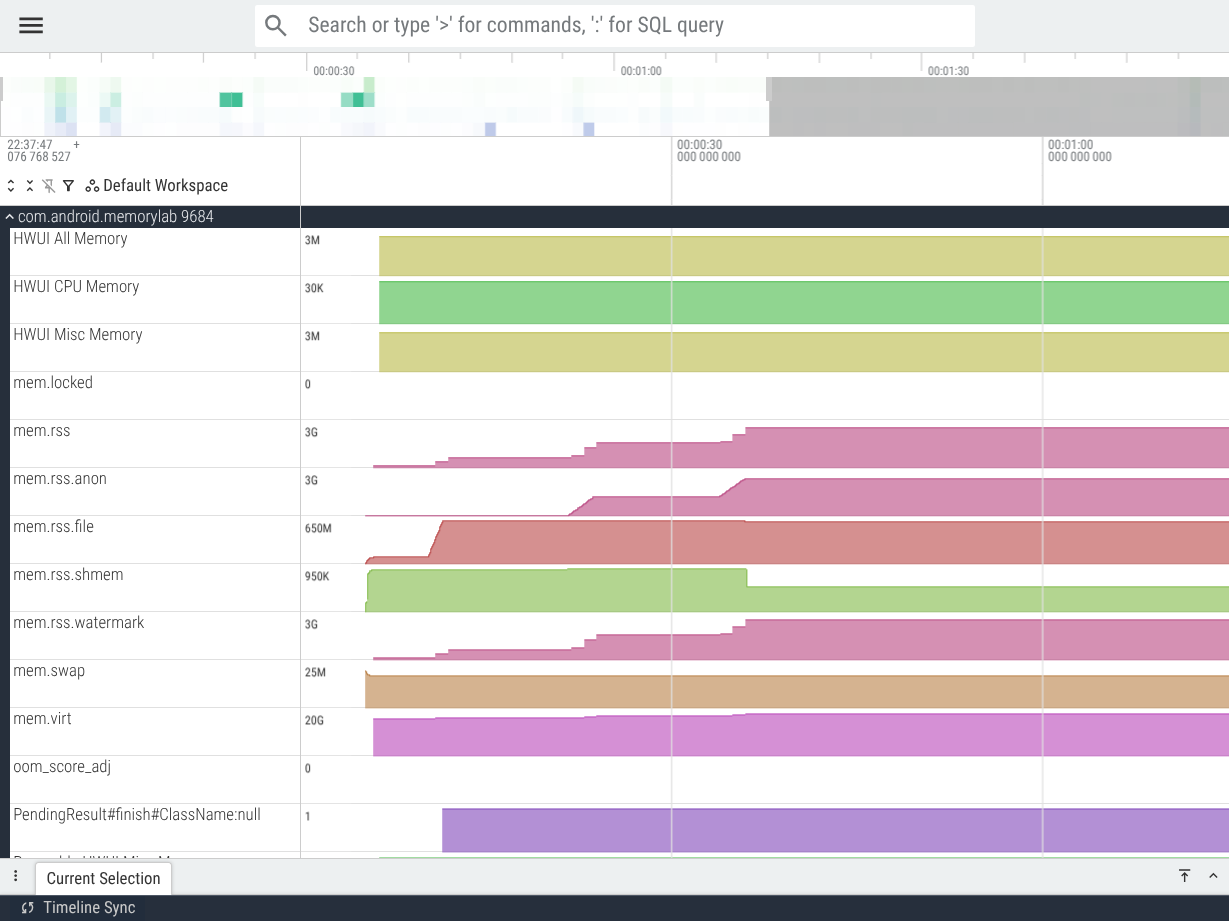
Configuring trace for memory counters
To capture these per-process counters in a trace, your Perfetto configuration
(pbtxt) must include the following data sources:
linux.ftracewithkmem/rss_stat: This event-based source captures instantaneous changes in RSS (Resident Set Size) as the kernel updates them. It provides high-resolution data forrss.anon,rss.file, andswap.data_sources: { config { name: "linux.ftrace" ftrace_config { ftrace_events: "kmem/rss_stat" # ... other events } } }linux.process_stats: This polled source provides the initial state of memory for all processes and periodic updates. It's essential for seeing the absolute memory values at the start of the trace.data_sources: { config { name: "linux.process_stats" process_stats_config { scan_all_processes_on_start: true proc_stats_poll_ms: 1000 # Optional periodic polling } } }
Pressure Stall Information (PSI)
PSI tells you how much time the system (or a specific process) spent waiting for memory resources.
some: At least one process was stalled waiting for memory.full: All non-idle processes were stalled simultaneously. This indicates a severe bottleneck.
You can inspect PSI values via ADB:
adb shell cat /proc/pressure/memory
Low Memory Killer (LMK)
The LMK is responsible for killing processes to free up memory when the system
is under pressure. On modern Android versions, the userspace lmkd daemon logs
to logcat, while kernel-level oom_kill events are logged to dmesg.
# Check userspace LMKD
adb logcat | grep -i "lmkd"

# Check kernel OOM killer
adb shell dmesg | grep -i "oom_kill"
In Perfetto, LMK events appear as markers in the system-wide tracks. Each event includes the PID of the killed process and the reason (e.g., "cache too low").
Kernel reclaim: swap and eviction
When the system runs low on free RAM, the kernel must find ways to free up space for new allocations. It does this through two primary mechanisms: swapping anonymous memory and evicting file-backed pages.
Anonymous memory and ZRAM
Anonymous memory (Java heap, native heap, stacks) has no corresponding file on storage. Android uses ZRAM, a compressed swap space in RAM, to manage this.
- Compression: The kernel identifies inactive anonymous pages and compresses them.
- Swap-out: The compressed pages are moved to the ZRAM region.
- Swap-in: When a process accesses a ZRAM page, the kernel decompresses it and places it back into regular RAM.
On Android, standard Linux swap counters like pswpin and pswpout
specifically track this ZRAM activity, as ZRAM is configured as the primary (and
usually only) swap device.
Inspecting ZRAM status
Global Totals: Use
/proc/meminfoto see how much ZRAM is configured and how much is currently used.adb shell cat /proc/meminfo | grep Swap # Example output: # SwapCached: 0 kB # SwapTotal: 2097148 kB # SwapFree: 1850244 kBSwapTotalis the total size of the ZRAM device.SwapTotal - SwapFreeis the amount of compressed data currently stored in ZRAM.Compression Ratio: To see how effective the compression is, compare the original size of the data to its compressed size on the ZRAM device.
# Original (uncompressed) size of stored data
adb shell cat /sys/block/zram0/orig_data_size
# 524288000 (500 MB)

# Compressed size of stored data
adb shell cat /sys/block/zram0/compr_data_size
# 104857600 (100 MB)
In this hypothetical example, the data is compressed at a 5:1 ratio. The actual compression ratio depends on the entropy in the uncompressed data.
Physical RAM Overhead: ZRAM itself uses RAM to manage the compressed blocks.
adb shell cat /sys/block/zram0/mem_used_total
# 115343360 (110 MB)
This is the actual amount of physical RAM currently occupied by the ZRAM device (compressed data + metadata).
Exercise: ZRAM compression ratios
In this exercise, you will observe how different types of data affect ZRAM efficiency, helping you build intuition for what to expect when analyzing real app memory.
- Prepare: Ensure MemoryLab is running. Tap Free All Allocations.
Baseline: Note the current ZRAM stats in
mm_stat:adb shell cat /sys/block/zram0/mm_stat # Columns: orig_data_size, compr_data_size, mem_used_total, ...Random Data (~1x ratio): Tap Allocate Native Memory (1GB Incompressible). Wait for swap-out (check
vmstator wait 10 seconds).- Observation: You will see
orig_data_sizeandcompr_data_sizeincrease by almost exactly the same amount. Random data has high entropy and cannot be compressed. This is the "worst-case" scenario.
- Observation: You will see
All 1's (~4x ratio): Tap Free All Allocations, then tap Allocate Native (1GB Ones) (
0xFF).- Observation: The
compr_data_sizewill increase by only about 250MB. This is is an ideal case for compression. The algorithm (usually LZO or LZ4) easily identifies the repeating pattern.
- Observation: The
All 0's (>100x ratio): Tap Free All Allocations, then tap Allocate Native (1GB Zeros) (
0x00).- Observation: You will see an exceptionally high ratio of
uncompressed to compressed data. The
orig_data_sizejumps by 1GB, butcompr_data_sizeandmem_used_totalbarely move. - The "Secret": This isn't compression, it's a kernel shortcut. The
ZRAM backend (
zsmalloc) detects pages filled with zeros and skips compression. Instead, it marks the page as a duplicate of the global Zero Page, consuming only a few bytes of metadata.
- Observation: You will see an exceptionally high ratio of
uncompressed to compressed data. The
ZRAM rules of thumb
When analyzing a real system, you can expect the following typical compression ratios. These estimates assume a standard 4KB page size and take into account the overhead of ZRAM's memory management:
| Data Type | Typical Ratio | Reason |
|---|---|---|
| Zeroed Pages | >100x | Optimized via kernel "Zero Page" shortcut (skips compressor). |
| Constant Pages | ~4x | Repeating values (e.g., 0xFF) compress perfectly, but per-page overhead and slab alignment limit the effective ratio. |
| Text / JSON / Logs | ~2.5x to ~3.5x | High redundancy, but higher entropy than a single repeated byte. |
| Java Heap | ~2x to ~3x | Many small objects with similar headers and sparse fields. |
| Machine Code (DEX/Native) | ~1.5x to ~2x | Instructions are dense but have recognizable patterns. |
| Decoded Bitmaps (UI) | ~2x to ~3x | Efficient if there are large flat color areas (icons, backgrounds). |
| Decoded Bitmaps (Photo) | ~1.1x to ~1.2x | Very high entropy; pixel values vary too much. |
| Encrypted/Compressed Data | ~1x | Already high-entropy; ZRAM cannot compress further. |
This is why we use random data for our primary memory pressure exercises: it's the worst case for compression because the data has maximal entropy, so swapping these pages to ZRAM doesn't increase the total size in RAM and therefore generates physical memory pressure faster than any other data.
Pagecache eviction
File-backed memory (DEX, libraries, assets) is managed via the page cache.
- Clean Pages: Pages that match the data on storage. These can be instantly dropped (evicted) by the kernel.
- Dirty Pages: Pages modified in RAM but not yet written back to storage. These cannot be dropped until they are written out.
Inspecting pagecache status
Global Totals:
/proc/meminfoshows how much memory is dedicated to the page cache.adb shell cat /proc/meminfo | grep -E "^(Cached|Active\(file\)|Inactive\(file\))" # Example output: # Cached: 1234567 kB # Active(file): 456789 kB # Inactive(file): 777778 kBThe kernel prefers to evict
Inactive(file)pages first. IfActive(file)is significantly larger thanInactive(file), it suggests most of the page cache is being actively used.Cumulative Faults: Monitor how many times the system has had to load pages from storage.
adb shell cat /proc/vmstat | grep -E "pgfault|pgmajfault"
# Example output:
# pgfault 12345678    # Total page faults (including minor/re-faults)
# pgmajfault 1234     # Major faults (actually required disk I/O)
"Memory Thrashing" is when significant time is spent swapping pages in and out of RAM rather than executing code and making progress towards the user's intended goal. A rapidly increasing
pgmajfaultcounter is a strong indicator of thrashing.
Runtime activity with vmstat
To see swap and eviction happening in real-time, use vmstat.
adb shell vmstat 1
# Example output:
# procs -----------memory---------- ---swap-- -----io---- -system-- ------cpu-----
#  r  b   swpd   free   buff  cache   si   so    bi    bo   in   cs us sy id wa st
#  1  0 246904 123456  12345 800000    0    0   120     0 1234 5678  5  2 92  1  0
Key columns for activity:
si/so: Swap-in and Swap-out from ZRAM. Non-zero values here mean the kernel is actively moving anonymous pages to/from compressed storage.bi/bo: Block-in and Block-out (I/O). Highbiduring memory pressure indicates frequent page cache re-faults (thrashing).wa(I/O wait): The percentage of time the CPU was idle while waiting for disk I/O. Highwais the performance "cliff" in action.
kswapd and direct reclaim
kswapd is a kernel thread that attempts to reclaim memory in the background
when free memory falls below a certain threshold.
- High
kswapdCPU usage: Indicates the system is constantly struggling to find free pages. - Direct Reclaim: If
kswapdcannot keep up, processes themselves are forced to reclaim memory synchronously before they can proceed with their own allocations. This shows up as "Direct Reclaim" events in Perfetto.
Thrashing and re-faults
A "re-fault" occurs when the kernel evicts a page that is still actively being used. If the system is constantly evicting and immediately reloading the same pages, it is thrashing.
Thrashing leads to high I/O wait (wa in tools like top or vmstat).
I/O wait represents the percentage of time the CPU was idle while waiting
for an outstanding disk I/O operation (like reloading an evicted DEX page) to
complete. High wa makes the device feel unresponsive even if total CPU usage
appears low.
System tuning: swappiness
The swappiness parameter decides whether the kernel should prefer to swap out
anonymous memory or evict file-backed memory.
adb shell cat /proc/sys/vm/swappiness
- Range: On modern Linux kernels (5.8+), the range is 0 to 200.
- 0: The kernel will only swap in extreme emergencies.
- 100: The kernel treats anonymous and file-backed memory equally.
- 200: The kernel aggressively prefers swapping anonymous memory to ZRAM to keep as much file-backed memory (page cache) in RAM as possible.
- Common Android Values: Most Android-powered devices are tuned with high swappiness, typically between 100 and 160 (some even use 200). This is because ZRAM swap is typically faster than reading back pages from UFS or eMMC storage, and preserving the page cache for app and system code and data is critical for app launch performance and overall system responsiveness. Contrast this with the typical setting on Linux desktop and server machines of 60, due to persistent storage being typically faster on these machines.
Hands-on exercise: page faults, page cache, and swap
In this exercise, you will use MemoryLab to trigger memory pressure and observe how the kernel responds with swap and eviction using Perfetto.
1. Prepare the device
Ensure your device or emulator has root access (adb root).
Launch the app and create a large test file (e.g., 500MB) that we will map later:
- Open MemoryLab.
- Tap Create Test File (500MB).
Wait for the logs to indicate completion.
2. Prepare for tracing
To ensure we see the file being loaded from storage, we need to clear the existing page cache.
# Stop the app to release its existing mappings
adb shell am force-stop com.android.memorylab

# Drop all clean caches
adb shell "echo 3 > /proc/sys/vm/drop_caches"
3. Record a Perfetto trace
Use a configuration that captures vmstat counters and page cache events.
Start a background Perfetto trace capturing vmstat counters and page cache events:
adb shell perfetto -c - --txt \
  -o /data/misc/perfetto-traces/swap_exercise.perfetto-trace --background <<EOF
buffers: { size_kb: 131072 }
data_sources: {
    config {
        name: "linux.sys_stats"
        sys_stats_config { vmstat_period_ms: 250 }
    }
}
duration_ms: 60000
EOF
4. Trigger memory pressure
- Launch MemoryLab.
- Tap Mmap thrash_test.bin (500MB File-backed). This maps our custom file.
- Tap Allocate Native Memory (1GB Incompressible) several times. Continue until the device feels sluggish. This forces the kernel to swap anonymous memory to ZRAM and eventually evict our mapped file from the cache.
- Tap Thrash Pagecache (Refault test). This repeatedly reads the mapped file, forcing re-faults if it was evicted.
5. Analyze the trace in Perfetto
Open the trace at ui.perfetto.dev.
Observe faults and swap
Look for the Memory group, then expand the vmstat group. This group contains various kernel-level counters that track memory management activity across the entire system.
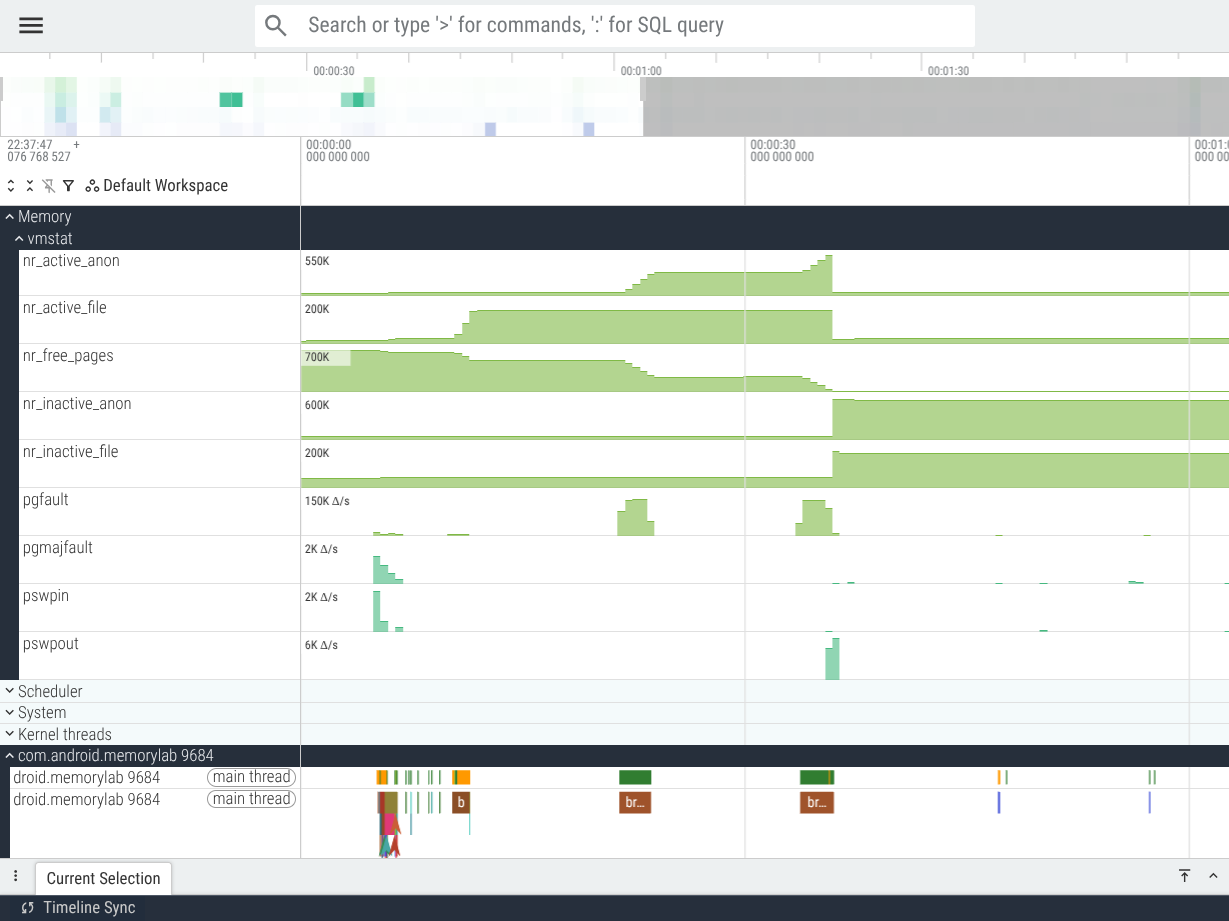
The tracks you see represent different aspects of the kernel's memory state:
Memory State Counters (Absolute Values): These tracks show the current amount of memory in a specific state. In the screenshot, these are displayed as absolute values (e.g., in KB or number of pages).
nr_free_pages: The amount of physical RAM that is completely free.nr_active_anon/nr_inactive_anon: Anonymous memory (like heaps and stacks) that is currently being used (active) or has not been accessed for a while (inactive). The kernel prefers to swap out inactive pages first.nr_active_file/nr_inactive_file: File-backed memory (page cache) that is active or inactive. Inactive file pages are the first candidates for eviction.
Activity Counters (Rates): For counters that represent a total count of events over time, such as page faults and swap operations, it is often more useful to view the rate of events rather than their cumulative total. In the Perfetto UI, you can hover the cursor over a counter track, click the metric icon, then click Mode and choose between Value, Delta, or Rate. The rate view makes it much easier to spot bursts of activity and correlate them with other system events.
pswpout(Swap Out): The rate at which anonymous pages are being compressed and moved into ZRAM. High spikes indicate intense memory pressure.pswpin(Swap In): The rate at which processes are reading back pages that were previously moved to ZRAM.pgfault(Total Page Faults): The rate of all page faults, including those that were handled without disk I/O (minor faults).pgmajfault(Major Page Faults): The rate of faults that required disk I/O to satisfy (e.g., reloading evicted code from storage). This is a key indicator of thrashing.
You'll notice in the screenshot that when nr_free_pages drops significantly,
we see corresponding spikes in pswpout as the kernel scrambles to free up RAM.
Later, as we "thrash" the page cache, we see spikes in pgmajfault and
nr_active_file.
Observe page cache eviction
To find page cache events in Perfetto: 1. In the search bar, type
mm_filemap_add_to_page_cache. 2. Events will appear as slices in the Ftrace
Events tracks (one track per CPU). 3. Expand the MemoryLab process. If
ftrace is correctly configured, you can see filemap activity correlated with the
process's threads.
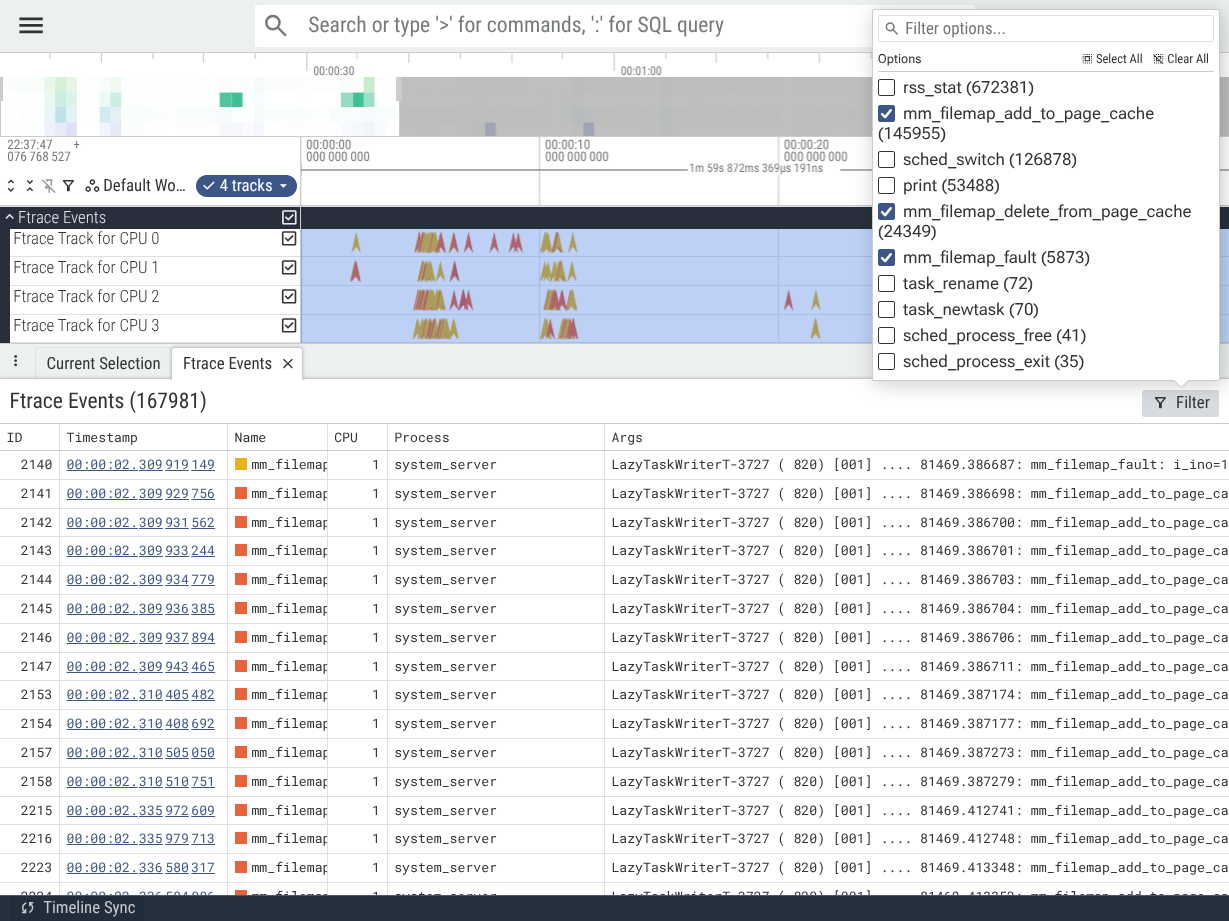
mm_filemap_add_to_page_cache: Indicates adding a page to the page cache.mm_filemap_delete_from_page_cache: Indicates a page was evicted from the cache.mm_filemap_fault: Indicates a page fault occurred on a memory-mapped file.
Resolving faults to inodes, then to files
Click on an individual add_to_page_cache event. In the Details panel, find
the i_ino (inode number). This identifies the specific file.
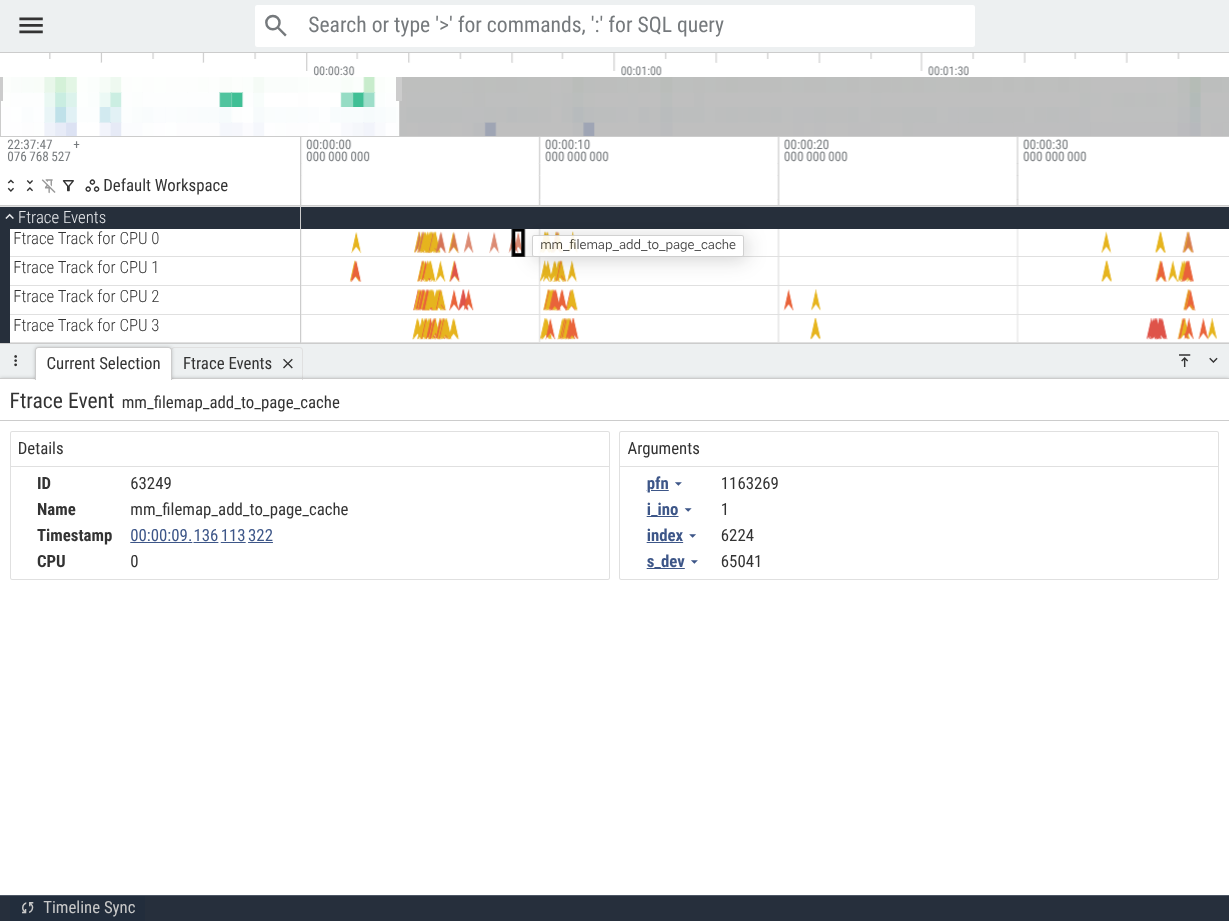
You can resolve an inode to a file path manually:
# Replace <INODE_NUMBER> with the value from Perfetto
adb shell find /system /data /apex /data/user/0 -inum <INODE_NUMBER>
Handy script: batch resolve inodes
If you have many events, you can use a PerfettoSQL query to extract all unique inodes from the trace and resolve them automatically using a helper script.
Extract Inodes: Use
trace_processorto get uniquei_inovalues:./trace_processor -Q "SELECT DISTINCT int_value FROM args t JOIN raw r ON r.arg_set_id = t.arg_set_id WHERE r.name = 'mm_filemap_add_to_page_cache' AND t.key = 'i_ino'" \ trace.perfetto-trace > inodes.txtResolve: Resolve the inodes directly from your terminal with a quick shell loop:
while read -r inode; do
  echo "Inode $inode -> $(adb shell find /system /data /apex /data/user/0 \
      -maxdepth 4 -inum "$inode" 2>/dev/null)"
done < inodes.txt
Example output from a Pixel 10a:
Resolving 10 unique inodes for device localhost:27198...
Inode 14051 -> /data/user/0/com.android.memorylab/files/thrash_test.bin
Inode 1382 -> /system/framework/framework.jar
Inode 203 -> /system/bin/cmd
Inode 17998 -> /data/misc/logd/logcat
← Service bindings | ↑ Up | Reclaim →