

您编写的代码本身就是一种内存使用形式。应用中的每个类、方法和字符串常量在执行时都必须加载到 RAM 中。应用的代码库越大,仅为了存在而消耗的内存就越多。
有文件支持的内存和按需分页
Android 使用 mmap 从您的 .apk(例如 .oat 或 .so 文件)加载可执行代码。这意味着该代码是文件支持的。
至关重要的是,Android 使用按需分页。当应用启动时,内核不会立即将整个 APK 加载到 RAM 中。而是仅将文件映射到进程的虚拟地址空间中。当应用执行时,如果 CPU 跳转到新函数,就会触发“页面错误”。内核会暂停线程,从存储空间中将该特定 4KB 代码页读取到物理 RAM 中,然后恢复执行。
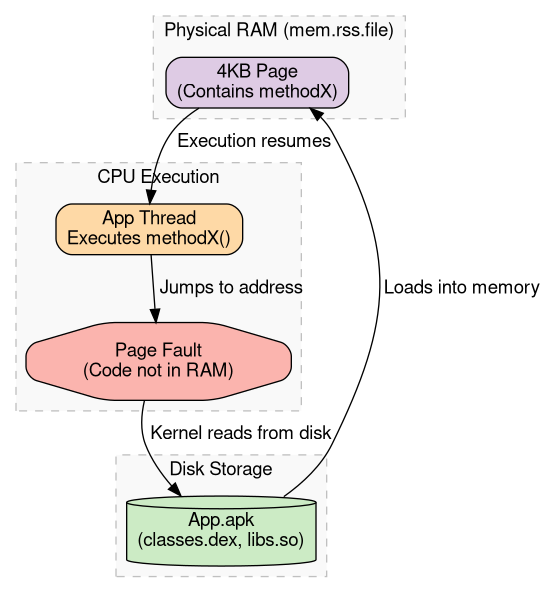
这意味着,您打包但从未执行的代码不会使用物理内存来存储代码页本身。不过,未使用的库仍会增加 APK 的总体大小,并会显著增加系统内部元数据(例如 DEX 索引和类描述符)所使用的内存,而这些元数据必须先经过读取,才能知道代码的存在。此外,许多库包含静态初始化程序,或者在应用启动期间被依赖注入框架触及,导致它们无论如何都会被分页到 RAM 中。
页面逐出和速度减缓
由于文件支持的内存始终可以从存储空间重新读取,因此内核会将这些页面视为“干净”页面。当系统遇到内存压力时,内核会从 RAM 中逐出(舍弃)这些干净的代码页,以便为其他内容腾出空间。
如果您的应用稍后需要再次执行该代码,CPU 将出现故障,并且内核必须从存储空间重新读取该页面。应用的代码越多,就越容易发生代码被逐出的情况。当用户在使用其他应用后返回到臃肿的应用时,由于 CPU 会不断停滞,等待从存储空间中分页调回代码,因此会遇到随机卡顿和速度变慢的情况。
缺页中断的代价:虽然缺页中断的代价会因设备的存储速度(UFS 与 eMMC)和内核状态而有很大差异,但一次严重缺页中断(从存储空间读取 4KB 数据)的代价可能介于 0.5 毫秒到 5 毫秒之间。如果您的启动路径涉及 500 个不同的未优化代码页面,您很容易就会在应用启动时间中引入数百毫秒的纯 I/O 延迟时间。
使用 Compiler Explorer 探索代码大小
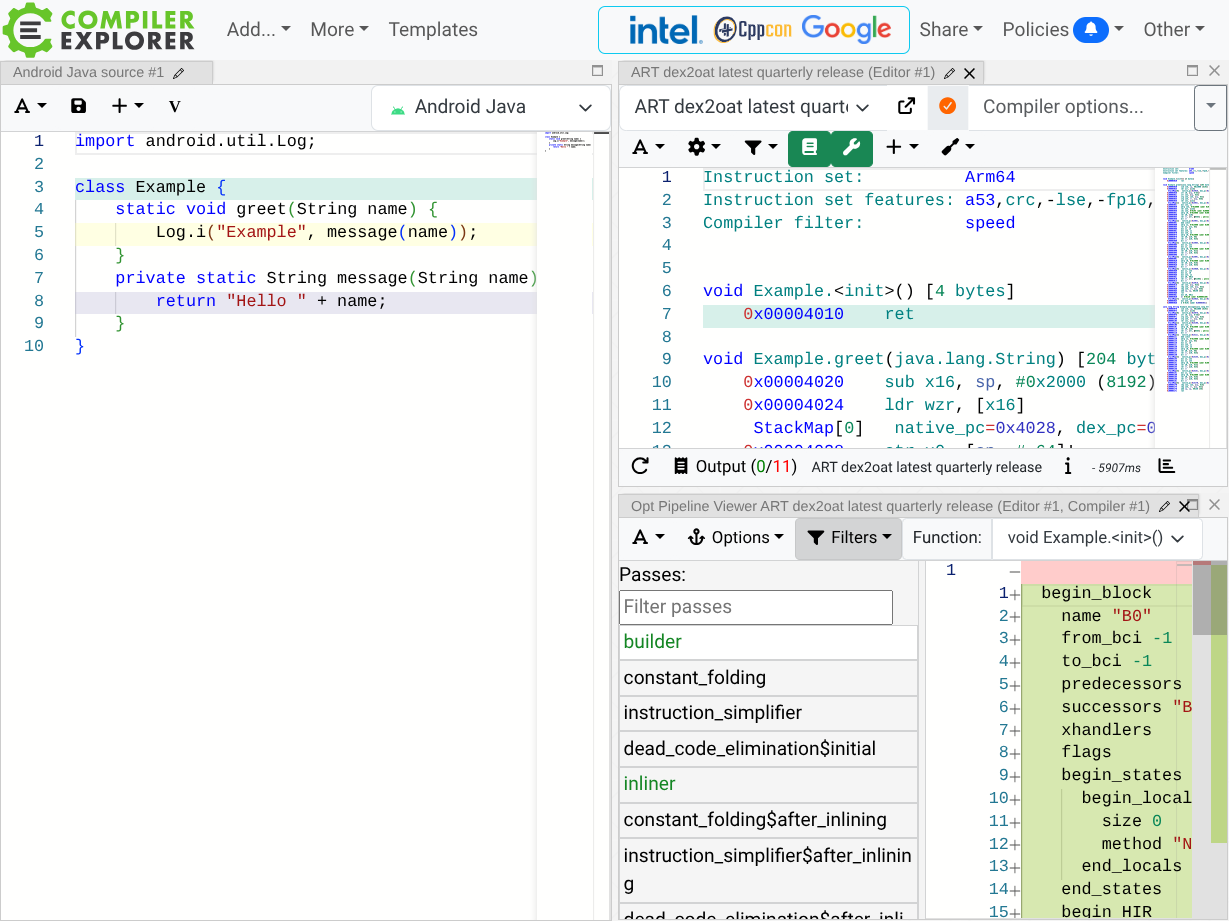
如需直观了解 Java 或 Kotlin 代码如何转换为原生机器代码(以及内存字节),您可以使用 Compiler Explorer。
Android 支持直接内置于 Godbolt 中。借助此工具,您可以了解 Android 工具链的不同部分(D8、R8 和 dex2oat)如何转换您的源代码。
如何将 Compiler Explorer 与 Android 搭配使用
- 前往 godbolt.org。
- 从语言下拉菜单(左上角)中选择 Android Java 或 Android Kotlin。
- 在编译器下拉菜单(代码窗格的右上角)中,您可以选择不同的工具:
d8:显示 Dalvik 字节码 (.dex)。这是最接近原始代码的表示形式,并且更易于阅读。r8:展示了 R8 优化工具如何缩减和优化字节码。dex2oat:显示实际在设备上执行的最终 ARM64 机器代码。您可以在此处看到实际的内存影响(每条指令 4 个字节)。dex2oat可以定位不同的 ISA,但 ARM64 是移动电话最常用的 ISA。
- 源代码<>输出突出显示:将鼠标悬停在某行代码上,系统会突出显示相应的字节码或机器代码指令,从而轻松跟踪特定语句的影响。
- 优化流水线:在反汇编视图中,您可以点击 Add new…-> Opt Pipeline。这样您就可以看到编译器执行的内部步骤。您可以检查 Internal Representation (IR) 在每个阶段(例如,在“Inliner (before)”和“Inliner (after)”步骤之间)的转换方式,然后再将其降级为最终的 ARM64 机器代码。
这对记忆有何影响
您在 dex2oat 输出中看到的所有以 ARM64 ISA 为目标的指令在应用的可执行文件(.odex 或 .oat)中都占用 4 个字节。
尝试输入利用不同语言功能的代码,并研究编译器的输出:
- 数组访问与列表迭代器:
- 对
int[]进行的简单数组循环可能会编译为大约 10 条指令(大约 40 字节)。 - 对
List进行的 foreach 循环会隐式使用Iterator。由于额外的方法调用(hasNext()、next())以及迭代器对象本身的分配,这可能会导致 30-40 条指令(约 160 字节)。 - R8 优化:在合适的条件下(例如,当
List被证明是ArrayList时),R8 优化器可以将 foreach 循环转换回简单的索引循环,从而消除迭代器开销并减少代码大小和运行时内存抖动。
- 对
- 虚拟方法调用:涉及加载对象的类、在
vtable中查找方法,然后进行分支。这通常需要 4-5 条指令(约 20 字节)。 - 直接/静态调用:通常会转换为单个
bl(带链接的分支)指令(4 字节)。 - Kotlin Lambda:可以生成整个匿名类和其他桥接方法,从而为简单的功能块增加数百字节的代码和元数据开销。
通过使用 Compiler Explorer,您可以了解复杂的语言功能(例如 Kotlin lambda、Stream API 或大量使用泛型)如何影响应用的最终编译大小,以及 R8 等优化器如何在某些情况下抵消语言抽象的成本。此工具可帮助您在设计和实现应用时做出明智的权衡。
一般来说,应用代码越复杂,内存用量就越高。 反之,更简单的代码(或经过 R8 简化的代码)在存储空间和 RAM 中以 CPU 指令和字节表示时会更小。
使用 meminfo 和 showmap 衡量代码影响
您可以使用标准的 Android 内存工具来查看应用的内存消耗量。
dumpsys meminfo
运行 adb shell dumpsys meminfo <package> 时,“应用摘要”部分中的“代码”类别会提供代码相关内存的高级视图:
 App Summary
                       Pss(KB)
                        ------
           Java Heap:     3244
         Native Heap:     5412
                Code:    24512  # <--- Sum of .so, .dex, .oat, .art, etc.
showmap
如需更精细的视图,请使用 showmap。它显示了特定文件映射到内存的区域。
adb shell showmap $(pidof <package>) | grep -E "\.oat|\.odex|\.dex|\.apk"
您会看到应用已编译代码的条目:
   size      RSS      PSS    clean    dirty    clean    dirty     swap  swapPSS object
------- -------- -------- -------- -------- -------- -------- -------- -------- ----------------
  12288     8192     8192     8192        0        0        0        0        0 /data/app/.../base.odex
无效代码和 R8
由于每个执行的方法都会占用内存,因此如果应用“臃肿”,包含不必要的初始化或未使用的库,可能会严重影响启动性能和基准内存使用量。
因此,R8 (ProGuard) 等工具至关重要。R8 会分析应用的字节码,并移除从未被调用的任何类或方法(“剥离无用代码”)。
实操练习:臃肿的代价
为了演示代码大小的影响,我们假设有一项实验比较了应用的两个 build,其中包含 300 个生成的类(每个类有 500 个方法):
- CodeBloat(未优化):包含所有生成的类和唯一字符串的标准未优化 build。
- CodeBloatOptimized:相同的源代码,但编译时启用了 R8 缩减。
1. 预先 (AOT) 编译
为了最大限度地提高文件支持的内存的影响,我们将使用 cmd package compile 工具将应用提前 (AOT) 编译为 .oat 文件。
adb shell cmd package compile -m speed -f com.android.codebloat
adb shell cmd package compile -m speed -f com.android.codebloat.optimized
请注意,这是一个合成示例。通常,应用会使用 speed-profile 编译模式(请参阅下文)。
2. 发布和比较
为了看到系统必须从存储空间读取代码的真正冷启动,我们将在启动每个应用之前丢弃内核的页面缓存。这需要 root 访问权限。
启动未优化的应用:
adb shell am force-stop com.android.codebloat
# Drop page cache to ensure the start is truly cold
adb shell "echo 3 > /proc/sys/vm/drop_caches"
adb shell am start -W -n com.android.codebloat/.MainActivity
sleep 5 # Wait for the background thread to load classes
adb shell dumpsys meminfo -s com.android.codebloat
现在,对优化后的应用执行相同的操作:
adb shell am force-stop com.android.codebloat.optimized
# Drop page cache to ensure the start is truly cold
adb shell "echo 3 > /proc/sys/vm/drop_caches"
adb shell am start -W -n com.android.codebloat.optimized/com.android.codebloat.MainActivity
sleep 5
adb shell dumpsys meminfo -s com.android.codebloat.optimized
成果
如果您查看 App Summary 部分中的代码行,就会发现巨大差异:
- 未优化
Code:约 30,000 KB(30 MB) - 已优化
Code:约 2,000 KB(2 MB)
由于 R8 确定这些类中的 500 个方法实际上从未执行任何有用的操作(doSomething() 方法仅调用 method0(),并且结果会被忽略),因此它从最终 APK 中剥离了几乎所有人工生成的代码。
3. 在 Perfetto 中查看影响
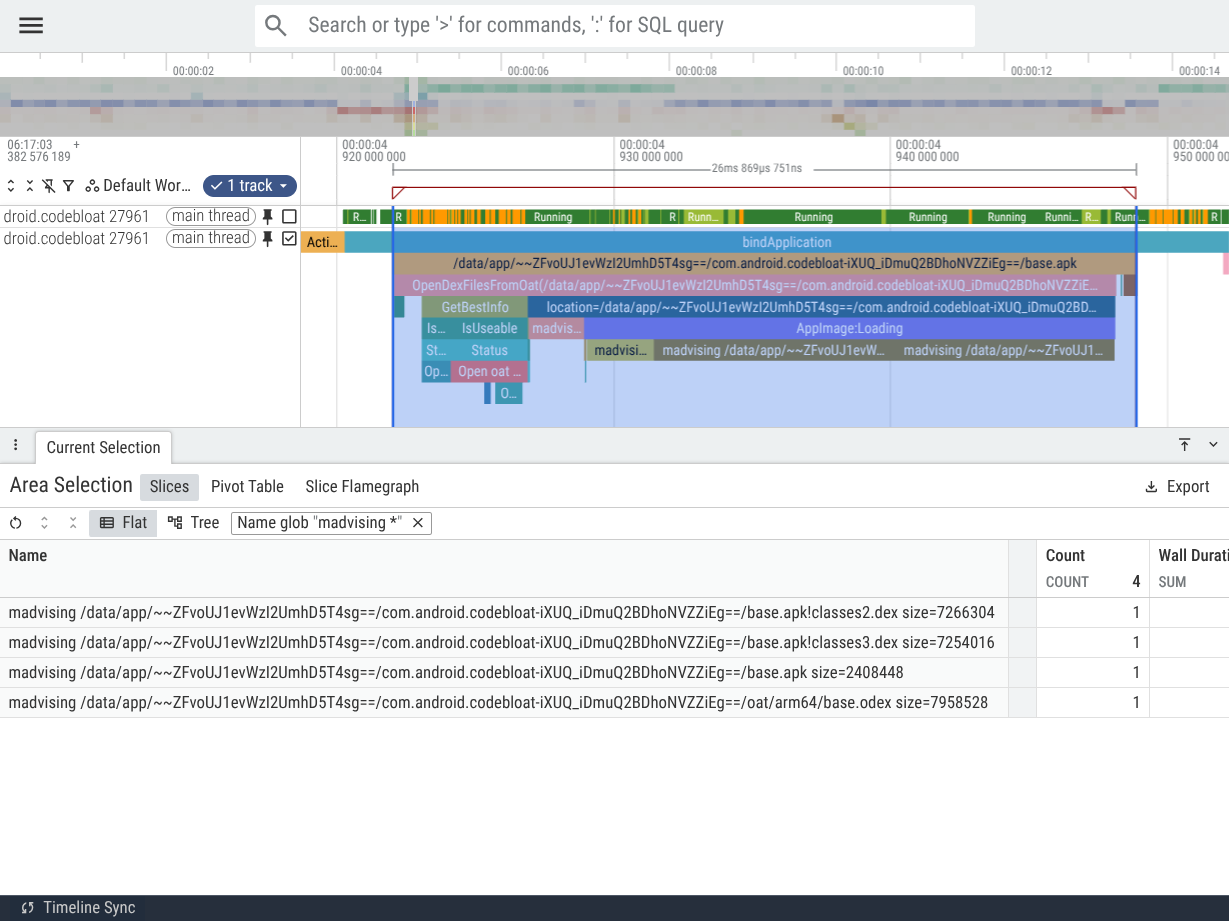
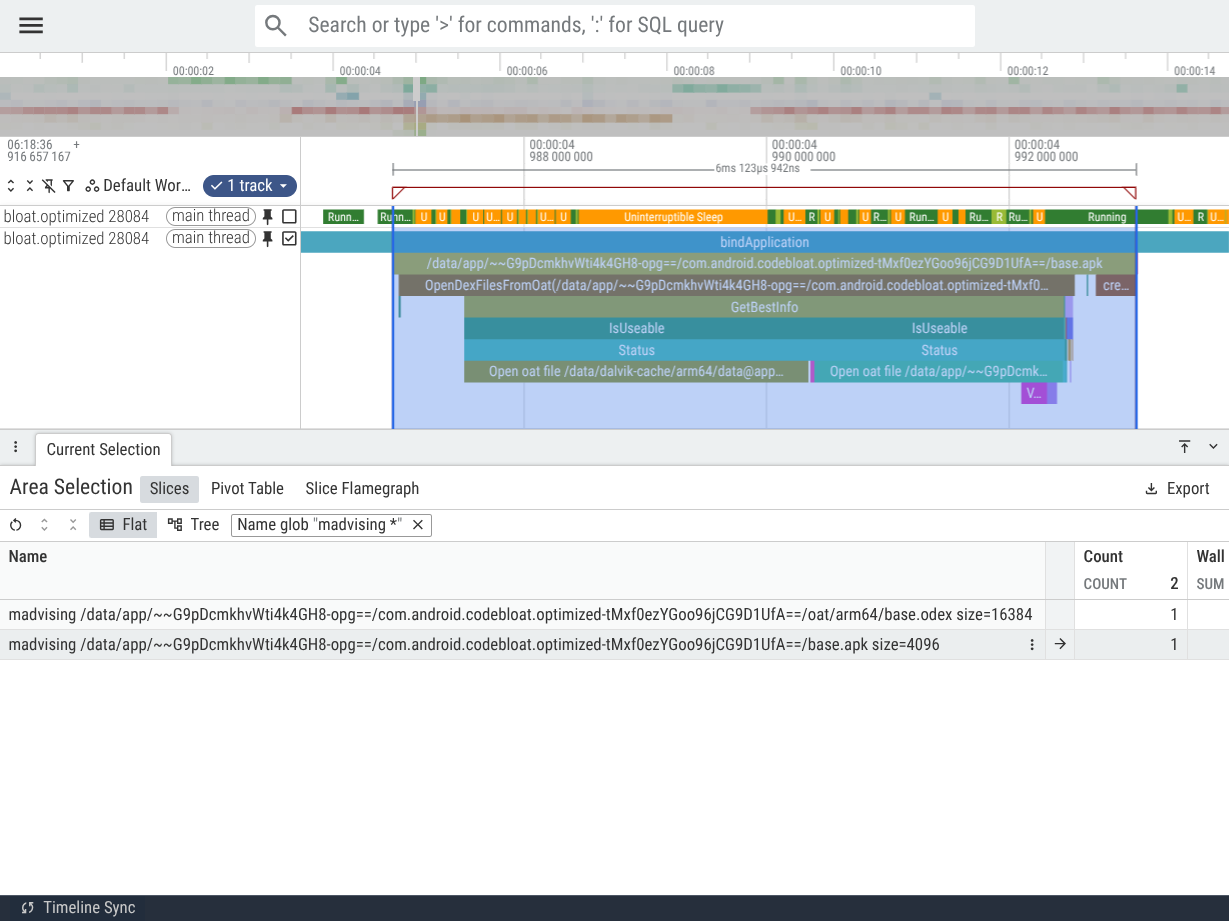
在应用的初始加载阶段,代码膨胀的影响非常明显。具体而言,请在主线程上查找 bindApplication slice,以及以 madvising 开头的嵌套 slice,这些 slice 表示系统正在准备从 APK 及其编译后的代码 (.odex) 加载文件。
在交互式冷启动时,系统会从这些文件中加载应用加载和运行所需的 mmap() 和 madvise() 代码以及其他数据。madvising slice 中“size=”后面的值表示需要加载多少数据。预提取应用代码是为了加快应用启动速度。
从比较中可以看出,在臃肿的应用中,需要从存储空间加载到 RAM 的应用代码量要大得多,从而导致持续时间更长,进而导致应用启动速度变慢。此外,臃肿应用的启动轨迹显示了用于加载辅助 DEX 文件(classes2.dex、classes3.dex)的切片,这些文件是臃肿应用被迫“溢出”到的,因为它们无法容纳在一个 DEX 文件中。
相比之下(Pixel 10a 上的冷启动)
| 指标 | 未优化(代码膨胀) | 优化(CodeBloatOptimized) |
|---|---|---|
base.odex madvise 大小 |
~7.9 MB(2.0 毫秒) | 约 16 KB(0.003 毫秒) |
base.apk madvise 大小 |
约 2.4 MB(2.4 毫秒) | 约 4 KB(0.001 毫秒) |
classes2.dex madvise 大小 |
~7.3 MB (8.6 毫秒) | 不适用 |
classes3.dex madvise 大小 |
~7.3 MB(8.0 毫秒) | 不适用 |
总共 madvising 时长 |
~21 毫秒 | ~0.004 毫秒 |
应用加载性能未优化
优化了应用加载性能
代码膨胀的影响因应用大小、用户设备特征和系统负载而异。
用于加载分析的 PerfettoSQL
您可以使用以下查询从轨迹中提取这些指标。
1. 应用启动时长
此指标显示了从应用的 activity 启动到该 activity 绘制第一帧所用的时间。
INCLUDE PERFETTO MODULE android.startup.startups;

SELECT package, dur, startup_type
FROM android_startups
WHERE package LIKE 'com.android.codebloat%';
请参阅:了解不同的应用启动状态
应用的启动时长不仅受本指南中介绍的因素影响,还受许多其他因素影响!
2. 提取 madvising 大小和时长
此查询重点关注我们上面看到的 madvising 部分。
INCLUDE PERFETTO MODULE slices.with_context;

SELECT
  name,
  dur/1e6 AS dur_ms
FROM thread_slice
WHERE process_name LIKE 'com.android.codebloat%'
  AND name LIKE 'madvising %';
3. 主线程状态细分(每种状态的总时长)
此查询显示了应用的主线程在不同状态下花费的时间。
SELECT
  p.name AS process_name,
  state,
  sum(dur)/1e6 AS total_dur_ms
FROM thread_state ts
JOIN thread t USING (utid)
JOIN process p USING (upid)
WHERE p.name LIKE 'com.android.codebloat%'
  AND t.is_main_thread = 1
GROUP BY p.name, state;
您可以优化查询,使其仅查看应用启动期间的主线程状态。
INCLUDE PERFETTO MODULE android.startup.startups;

SELECT
  p.name AS process_name,
  ts.state,
  -- Calculate only the duration that falls within the startup window
  SUM(
    MAX(0,
      MIN(ts.ts + ts.dur, s.ts + s.dur) - MAX(ts.ts, s.ts)
    )
  ) / 1e6 AS startup_dur_ms
FROM thread_state ts
JOIN thread t USING (utid)
JOIN process p USING (upid)
-- Join on the package name to align thread states with the correct startup
JOIN android_startups s ON s.package = p.name
WHERE p.name LIKE 'com.android.codebloat%'
  AND t.is_main_thread = 1
  -- Only select thread states that overlap with the startup interval
  AND ts.ts + ts.dur > s.ts
  AND ts.ts < s.ts + s.dur
GROUP BY 1, 2
ORDER BY startup_dur_ms DESC;
这可能会暴露一些有趣的问题,例如:
- 可运行 (R) 但未运行的时间较长:这表明应用的启动因 CPU 争用而延迟,即应用的主线程无法运行,因为其他线程(可能来自其他应用)占用了 CPU。
- 在可中断睡眠状态 (D) 下花费的时间较长:这通常表示 I/O 速度较慢或内存压力过大,导致应用启动停滞。
- 休眠 (S) 时间过长:这意味着主线程在等待其他线程执行工作。有时,这表示应用的启动路径中存在锁争用(即主线程被应用中另一个线程占用的独占资源阻塞)。
4. 最大文件支持内存(RSS 文件)
此指标与应用在启动时加载的代码和数据量密切相关。“臃肿”程度较高的应用在此处会达到较高的数值,从而导致系统内存压力。这种压力可能会反过来延迟应用的启动,因为系统会努力满足分配请求,或者将 CPU 时间从专注于启动应用转移到从其他进程回收内存,以满足启动应用的即时需求。
SELECT
  p.name AS process_name,
  max(c.value)/1024.0/1024.0 AS max_rss_file_mb
FROM counter c
JOIN process_counter_track t ON c.track_id = t.id
JOIN process p USING (upid)
WHERE p.name LIKE 'com.android.codebloat%'
  AND t.name = 'mem.rss.file'
GROUP BY p.name;
ART 编译模式和内存
Android 运行时 (ART) 可以通过多种不同的模式(也称为编译器过滤器)编译应用代码。所选的编译器过滤条件会直接影响应用的内存占用。
verify:ART 仅执行字节码验证。不执行 AOT 编译。代码通过解释器执行,或在运行时由 JIT 编译器编译。- 内存影响:磁盘上占用的空间最小。原生代码内存用量会推送到
JIT Cache(匿名脏内存)。
- 内存影响:磁盘上占用的空间最小。原生代码内存用量会推送到
speed:ART 会对所有方法执行完整的 AOT 编译。- 内存影响:最大
.odex大小。尽可能提高文件支持的(干净)内存使用率。
- 内存影响:最大
speed-profile:ART 仅编译在 JIT 配置文件中标记为“热门”的方法。- 内存影响:平衡方法。只有最关键的代码会进行 AOT 编译。
最常见的过滤条件是 speed-profile,用于安装用户应用时。此功能在系统属性 pm.dexopt.install 和 pm.dexopt.bg-dexopt 中配置,通常在 build/make/target/product/runtime_libart.mk 中设置。
某些系统应用将使用 speed 编译,并且还将在系统映像构建时进行编译。verify 通常仅用于开发用例。
| 使用场景 | 典型的编译器过滤条件 |
|---|---|
| 开发 | verify |
| 系统映像 | speed |
| 用户应用 | speed-profile |
实操练习:编译模式和内存
我们可以使用 CodeBloat 应用来查看这些过滤条件对内存的影响。如需重现这些测量结果,请执行以下操作:
- 强制将应用重新编译为目标模式。
- 强行停止并冷启动应用。
- 等待后台线程完成触控类(查看 logcat 或等待 5 秒)。
- 运行
adb shell dumpsys meminfo com.android.codebloat。
模式:verify(无 AOT)
adb shell cmd package compile -m verify -f com.android.codebloat
adb shell am force-stop com.android.codebloat
adb shell am start -W -n com.android.codebloat/.MainActivity
sleep 5
adb shell dumpsys meminfo com.android.codebloat
在 verify 模式下,应用摘要显示:* 代码 PSS:约 8,000 KB * Dalvik 其他 (JIT):约 25,000 KB
由于没有代码经过 AOT 编译,因此运行时必须将热门方法 JIT 编译到 JIT 缓存中,这会显示为 脏匿名内存 (Dalvik
Other)。
模式:speed(完整 AOT)
adb shell cmd package compile -m speed -f com.android.codebloat
adb shell am force-stop com.android.codebloat
adb shell am start -W -n com.android.codebloat/.MainActivity
sleep 5
adb shell dumpsys meminfo com.android.codebloat
在 speed 模式下,结果会发生显著变化:* 代码 PSS:约 24,000 KB * Dalvik 其他 (JIT):约 5,000 KB
应用的代码现在从 .odex 文件映射为干净的文件支持内存。这样可以减轻 JIT 缓存的压力,并使内存在压力下可以被逐出,而不是“卡住”成为脏 RAM。
模式:speed-profile(选择性 AOT)
现代应用可能会捆绑 baseline.prof 基准配置文件。ART 会使用此信息来选择性地仅编译快速、高效启动所需的代码。
在此练习中,我们将创建一个基准配置文件,以列出应用的启动类。不过,实际上,编译器也可能会从应用商店(“云配置文件”)等外部来源接收配置文件,这些配置文件可以为应用提供众包的 JIT 配置文件,无论开发者是否还捆绑了他们生成的基本配置文件。
生成和使用设备端配置文件
如需了解 speed-profile 的影响,您可以在设备上生成自己的配置文件:
重置并开始:
adb shell am force-stop com.android.codebloat互动:启动应用并让其运行启动序列。
转储配置文件:
adb shell kill -s SIGUSR1 $(pidof com.android.codebloat)(这会强制应用将其当前配置文件写入磁盘)。
安装配置文件:
adb shell cp /data/misc/profiles/cur/0/com.android.codebloat/primary.prof \ /data/misc/profiles/ref/com.android.codebloat/primary.prof编译:
adb shell cmd package compile -m speed-profile -f com.android.codebloat
再次启动时,您会看到一个平衡点:代码 PSS 将低于 speed(例如,约为 16,000 KB),因为只有“热门”启动方法被编译,其余部分仅在实际使用时由解释器或 JIT 处理。
请参阅:
深入了解已编译的代码
如果您想确切了解 ART 生成的指令,请参阅 art/DISASSEMBLY_GUIDE.md。
其中详细介绍了如何使用以下功能:
oatdump:查看现有.odex文件中的 ARM64 指令。dex2oat:用于模拟使用详细调试标志进行的编译。
练习:代码内嵌
编译后的代码可能会意外增长,原因之一是方法内联。编译器可能会决定将一个经常调用的小型方法的正文直接复制到其调用方中。
在我们的 CodeBloat 应用中,每个生成的类中的 doSomething() 方法都只是调用 method0()。在 speed 模式下编译时,ART 的优化编译器可能会将 method0() 内嵌到 doSomething() 中。
练习:在设备上使用 oatdump 验证这一点:
# 1. Find the path to the application's APK and compiled .odex file
adb shell pm path com.android.codebloat
# Output: package:/data/app/~~.../base.apk

adb shell "dumpsys package com.android.codebloat | grep 'location is' | head -n 1"
# Example output: [location is /data/app/~~.../oat/arm64/base.odex]

# 2. Run oatdump (substituting the correct path to base.odex)
adb shell oatdump --oat-file=/data/app/~~.../oat/arm64/base.odex \
                  --class-filter=com.android.codebloat.GeneratedClass0
在输出中查找 doSomething 方法。如果它已内联,您将看到直接在 doSomething 中加载长字符串常量的指令,而不是以 method0 为目标的 bl 指令。
直观呈现优化 (CFG)
如需确切了解编译器何时决定内联方法,您可以生成控制流图 (CFG)。这会显示优化流水线每个阶段的代码状态,包括编译器中间表示 (IR) 的每次转换,直到代码降至目标 ISA(例如 ARM64)。
运行
dex2oat并使用 dump 标志:使用--verbose-methods标志将输出限制为特定方法;否则,大型应用的.cfg文件可能会增长到几 GB。# Substitution of actual paths required: adb shell dex2oat64 --dex-file=/data/app/~~.../base.apk \ --oat-file=/data/local/tmp/dump.odex \ --compiler-filter=speed \ --dump-cfg=/data/local/tmp/codebloat.cfg \ --verbose-methods=doSomething拉取并查看:将
.cfg文件拉取到工作站,然后使用 IR Hydra 打开该文件。查找 Inliner:在 IR Hydra 中,加载编译制品并搜索
doSomething。比较 Inliner 传递前后的表示形式。您会看到,随着来自method0的指令合并到调用方中,图会展开。
或者,您也可以使用 Compiler Explorer 中的 Opt Pipeline 工具(如上文所述),输入类似的代码,查看在 Inliner 传递中执行的类似转换。
练习:易变字段和内存屏障
在 MemoryLab 应用中,mGarbageSink 字段标记为 volatile。这样可确保编译器不会优化掉我们的垃圾分配。
public volatile byte[] mGarbageSink;
在 ARM64 反汇编中,您会看到对该字段的每次存储都伴随着内存屏障 (Memory Barrier) (dmb ish) 或使用 Load-Acquire/Store-Release () 指令 (ldar/stlr)。这可确保线程可见性,但每次访问都会增加一些额外的指令,与常规字段相比,代码大小略有增加。
练习:在反汇编中查找字段访问和关联的内存屏障。
练习:隐式挂起检查
如果您反汇编一个循环(例如 generateAllocationChurn 中的循环),您会注意到循环体末尾有一条奇怪的指令:
ldr x21, [x21]
这是隐式挂起检查。ART 使用此功能来允许垃圾收集器安全地暂停线程。寄存器 x21 通常指向自身。
当 GC 需要暂停线程时,它会“毒化”该内存位置。当线程下次执行该 ldr 时,会触发一个故障,运行时会捕获该故障并使用它将线程转换为暂停状态。
此模式在每个循环中和每个方法的开头都会重复出现,从而增加了应用的总体代码大小。
练习:在方法反汇编中找到所有隐式挂起检查,并尝试将它们与原始源代码相关联。