

虽然内存通常被视为一个统一的存储池,但其物理组织方式以及 CPU 访问内存的方式会对应用性能产生深远影响。了解内存局部性是编写高性能代码的关键,可有效利用 CPU 的缓存层次结构。
CPU 缓存层次结构
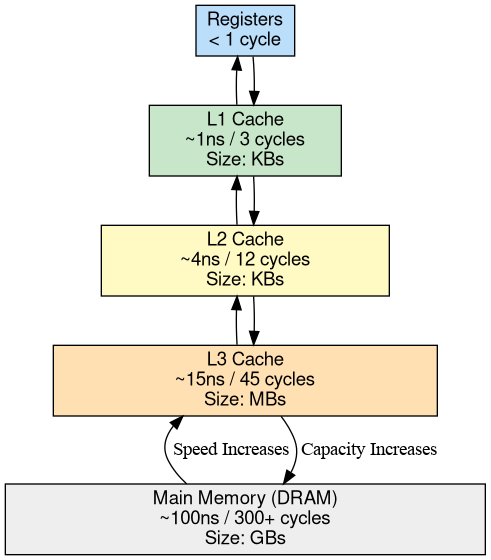
现代移动 CPU 的速度比系统的主 RAM (DRAM) 快得多。为了弥合这种性能差距,CPU 使用了多个级别的小型极快内存,称为缓存。
- L1 缓存(1 级):最小且最快(约 1 纳秒)。在 3GHz CPU 上,这大约是 3 个时钟周期。
- L2 缓存(二级):更大,速度稍慢(约 3-5 纳秒或约 10-15 个周期)。
- L3 缓存(3 级):最大的缓存(约 10-20 纳秒或约 30-60 个周期)。
- 主内存 (DRAM):最大且最慢(~100 纳秒以上,或 ~300 个周期以上)。
延迟的背景信息:停顿的代价
为了解这些数字的影响,请考虑一个现代超标量 CPU,它每个时钟周期可以完成 4 到 8 条指令。
如果 CPU 错过了所有缓存,并且必须等待 100 纳秒(300 个周期)才能进行 DRAM 读取:
- 丢失的周期数:约 300 个周期。
- “浪费”指令数:如果数据已位于本地寄存器或 L1 缓存中,则本应执行的指令数介于 1,200 到 2,400 条之间。
如果代码的内存局部性较差,CPU 不一定忙于复杂的数学运算;它经常会“停滞”,在等待内存子系统时,会空闲数千个指令等效时间。
每个周期的指令数 (IPC)
衡量此效率的关键指标是每周期指令数 (IPC)。 IPC 表示 CPU 在每个时钟周期内平均成功“退役”(完成)的指令数。
- 高 IPC(例如 3.0 - 5.0):CPU 以高效率运行,很可能在 L1/L2 缓存或寄存器中找到大部分数据。
- IPC 较低(例如 < 0.5):CPU 严重受限。即使 CPU 在系统监控器中的“使用率”达到 100%,实际上大部分时间都用于等待内存,这种状态称为内存停滞。
内存局部性是决定数据密集型循环是以高 IPC 运行还是崩溃为一系列停滞的主要因素。
缓存行
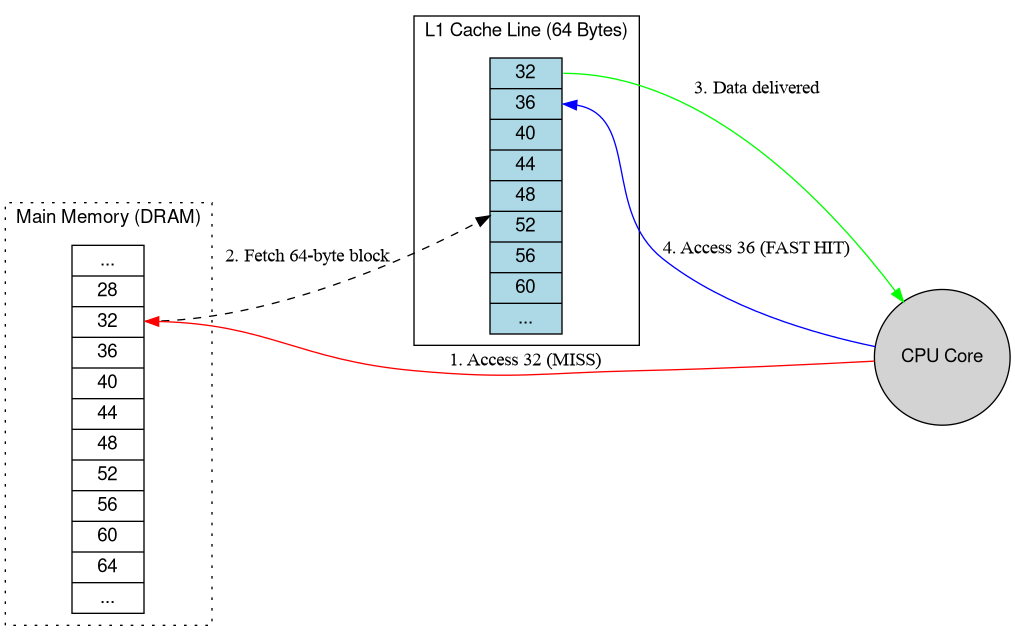
CPU 不会从内存中加载单个字节。而是加载称为缓存行的固定大小的块,这些块通常为 64 字节。当您访问单个变量时,CPU 会将包含该变量的整个 64 字节块提取到缓存中。
TLB(地址转换旁路缓冲器)
Android 使用虚拟内存。每次内存访问都需要将虚拟地址转换为物理地址。TLB 是一种专门用于存储近期翻译的缓存。发生 TLB 未命中时,内核需要在主内存中遍历页表,与 TLB 命中相比,这是一项相对昂贵的操作。
硬件配置文件:Pixel 10 Pro Fold
在以下练习中,我们使用的是 Pixel 10 Pro Fold 硬件设备。 此设备搭载 Google Tensor G5 SoC。
查询硬件
为了解内存子系统,我们首先检查 CPU 配置和缓存参数。
# Check CPU architecture and core parts
adb shell cat /proc/cpuinfo | grep 'CPU part' | sort -u
# Output:
# CPU part  : 0xd8b
# CPU part  : 0xd8c
# CPU part  : 0xd90

# Check cache line size
adb shell getconf -a | grep CACHE_LINESIZE
# Output:
# LEVEL1_ICACHE_LINESIZE             64
# LEVEL1_DCACHE_LINESIZE             64
解读 CPU 部件
/proc/cpuinfo 中的 CPU part 值是 ARM CPU 核心的十六进制标识符。对于 Pixel 10 Pro Fold 中的 Laguna SoC,这些映射关系如下:
0xd8b:ARM Cortex-A520(能效核心)0xd90:ARM Cortex-A720(性能核心)0xd8c:ARM Cortex-X4(主核心)
这种 4+3+1 配置在现代移动 SoC 中很常见,其中不同的集群可能具有不同的缓存大小和延迟时间。
地区类型
高效的软件设计依赖于两种主要类型的局部性:
- 空间局部性:如果访问了某个内存位置,则很可能很快就会访问附近的内存位置。顺序数组遍历就是一个经典示例。由于 CPU 会加载整个缓存行,因此如果数组中的下一个元素已位于缓存行中,则访问该元素几乎是“免费”的。
- 时间局部性:如果访问了某个内存位置,则很可能很快会再次访问同一位置。优秀的算法会在数据仍处于缓存中的“热”状态时重复使用数据。
实践练习:使用 simpleperf 衡量局部性
在此练习中,我们将使用 simpleperf 监控在运行 256MB 矩阵的两种不同遍历时硬件性能计数器的变化。
- 按行遍历:按矩阵元素在内存中的存储顺序访问这些元素。这有利于缓存,并能利用空间局部性。
- 按列遍历:跨内存跳转以按列访问元素。这通常会错过缓存和 TLB,从而强制 CPU 停滞。
1. 使用 Simpleperf 运行
推送二进制文件,确保其可执行,并使用 simpleperf stat 衡量缓存和 TLB 事件。我们使用 :u 后缀来衡量用户空间中的事件。这些命令需要 adb root 访问大多数设备上的硬件 PMU 计数器。
adb root
adb shell "chmod +x /data/local/tmp/LocalityLab"
按行剖析:
adb shell "simpleperf stat -e cpu-cycles:u,instructions:u,cache-misses:u,L1-dcache-load-misses:u,dTLB-load-misses:u /data/local/tmp/LocalityLab row"
Profile Column-major:
adb shell "simpleperf stat -e cpu-cycles:u,instructions:u,cache-misses:u,L1-dcache-load-misses:u,dTLB-load-misses:u /data/local/tmp/LocalityLab col"
2. 测量结果示例(Pixel 10 Pro Fold)
以下结果是在 Pixel 10 Pro Fold 硬件设备上测得的:
| 指标 | 行优先(友好) | 列优先(不友好) | 差值 |
|---|---|---|---|
| 执行时间 | 0.83 秒 | 68.3 秒 | 慢了约 82 倍 |
| 说明 | 52.7 亿 | 102 亿 | 约 1.9 倍 |
| CPU 周期 | 12 亿 | 621.8 亿 | 大约 52 倍 |
| 每个周期的指令数 (IPC) | 4.40 | 0.16 | 效率降低 27 倍 |
| L1 数据缓存未命中 | 2.1 亿 | 33.69 亿 | 错过的机会多出 16 倍 |
| dTLB 加载未命中 | 0.13 百万 | 28.88 亿 | 漏报次数增加了 22,000 倍 |
3. 结果分析
- IPC 崩溃:在行优先测试中,CPU 的 IPC 为 4.40,表明它能够高效地在每个周期内执行多条指令。在列优先测试中,IPC 降至 0.16。这意味着 CPU 96% 的时间处于停滞状态,等待数据从 DRAM 到达。
- TLB 瓶颈:最显著的差异在于 dTLB-load-misses。顺序访问(行优先)会停留在同一内存页中,从而导致极少的 TLB 未命中。跨列跳转(列优先)会导致 CPU 不断引用新页面,从而使 TLB 过载并强制执行昂贵的页表遍历。
- 缓存效率:列优先遍历会产生 16 倍以上的 L1 缓存未命中,从而迫使 CPU 不断从速度慢得多的 L3 或 DRAM 中提取数据。
观察结果:尽管两种遍历方式对相同数据执行了相同的逻辑操作,但列优先遍历慢了 80 多倍。这种巨大差异完全是由于访问模式与 CPU 内存子系统的物理现实之间的交互方式造成的。
Java 和 Kotlin 数据结构中的指针追逐
虽然 2D 矩阵基准测试演示了连续原生数组中的空间局部性,但大多数 Android 应用和框架代码都是使用 Java 和 Kotlin 编写的。在受管语言中,对象变量和集合元素不会内联存储对象;它们会存储对分散在 ART 堆中的堆分配对象的引用(指针)。
嵌套引用图的费用
不妨考虑一下 Android 应用和系统服务中的常见模式:遍历嵌套集合,例如包含状态对象的 ArrayList,每个状态对象都包含监听器或连接的 ArrayMap 或 ArraySet,每个监听器或连接都指向另一个状态记录。
即使 ArrayList、ArrayMap 和 ArraySet 将其内部 Object[] 数组连续存储,该 Object[] 中的每个元素仍然是堆引用。对 process.services.valueAt(i).connections.valueAt(j).client 等链进行解引用需要五个连续的依赖性内存加载:
- 加载
Object[]后备services。 - 加载
ServiceRecord对象标题和字段。 - 加载
Object[]后备connections。 - 加载
ConnectionRecord对象。 - 加载目标
ProcessRecord字段。
由于每个加载的内存地址都取决于上一个加载返回的值,因此 CPU 的无序执行引擎和硬件预取器无法使它们重叠。如果这些对象是在不同时间分配的,或者在垃圾回收期间移动到不同区域,则每个跃点都有可能发生 L1 或 L2 缓存未命中。
封装的原始类型 (ArrayList<Integer>、HashMap<Long, Boolean>) 和泛型 lambda 会增加这种开销:每次元素查找都需要额外的指针取消引用来取消封装值,而泛型 Consumer<T> 回调会插入运行时类型检查 (CheckCast) 桩,从而增加指令缓存 (L1-icache) 压力。
使用 simpleperf 诊断指针追逐
在实际的 Java 和 Kotlin 工作负载(例如 system_server 的 OomAdjuster 遍历进程、服务和提供程序引用图)中,指针追逐很少会将 IPC 一直降至 0.16(如合成的 256 MB 列优先扫描),因为部分工作集适合 L2 或 L3 缓存。请改为在 simpleperf 中查找此特征签名:
- IPC 较低(大约为 0.6 到 0.9):远低于 CPU 的超标量退役宽度。
- 高后端内存停滞 (
raw-stall-backend-mem):通常,所有 CPU 周期的 35% 到 45% 都用于等待数据缓存填充。 L1-dcache-load-misses和L1-icache-load-misses升高:当热门遍历循环在虚拟方法和泛型 lambda 桩之间跳转时,数据缓存未命中率高,同时指令缓存未命中。
您可以使用 simpleperf stat 衡量正在运行的进程的这些计数器:
adb shell simpleperf stat \
  -e cpu-cycles:u,instructions:u,raw-stall-backend-mem:u,L1-dcache-load-misses:u,L1-icache-load-misses:u \
  -p $(pidof system_server) --duration 10
改进了托管代码中的局部性
- 将装箱集合替换为基本类型数组或 AndroidX 集合:使用
IntArray、LongArray、SparseIntArray或androidx.collection基本类型 (IntList、LongLongMap、ScatterMap) 来消除封装对象,并使值在单个数组分配中保持连续。 - 扁平化热门遍历路径:如果热门循环在对象图上重复遍历三到四跳,以读取单个布尔值或整数标志,请将该状态提升或缓存到由密集 ID 索引的扁平数组或位掩码中。
- 避免在紧凑的内部循环中捕获或使用泛型 lambda:使用标准的索引
for循环遍历RandomAccess列表,而不是forEach或迭代器链,以避免迭代器分配、巨型调度和运行时类型检查开销。
← Threads | ↑ Up | Service bindings →