

Java 和 Kotlin 应用通过垃圾回收堆来管理内存。当对象不再可访问时,垃圾回收器 (GC) 最终会回收其空间。当不再需要的对象仍被“GC 根”持有,导致无法回收时,就会发生内存泄漏。
核心概念
GC 根
垃圾收集根对象是一种特殊类型的对象,垃圾收集器始终将其视为可访问的对象。例如:
- 活跃线程(以及从其当前正在执行的 Java 堆栈帧引用的对象)。
- 具有正在运行的方法的类。
- JNI 引用(由原生代码持有的全局或本地引用)。
GC 根的路径
只要存在从 GC 根到对象的引用链,该对象就是“可访问”的,并且无法进行垃圾回收。此链称为“通往 GC 根的路径”。如需修复内存泄漏,您必须识别并打破此链。

支配树
虽然 GC 根的路径可以告诉您对象处于活跃状态的原因,但它无法告诉您如果该引用被中断,会有多少内存被回收。为此,我们使用支配树。
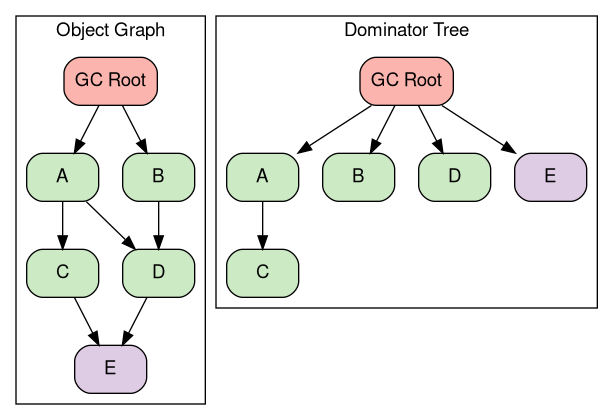
如果从任何 GC 根到 B 的每条路径都必须经过 A,则称对象 A 支配对象 B。如果 A 支配 B,那么回收 A 也将保证可以回收 B,因为从任何根到 B 都没有其他路径。
下图显示了一个对象图及其对应的支配树。请注意,对象 D 可通过图中的 A 和 B 到达,因此 A 和 B 都不是 D 的支配者;相反,GC 根是其最近的支配者。
获取 Java 堆转储
堆转储是 Java 堆中所有对象在特定时间点的快照。
使用 ADB
如需从正在运行的进程中捕获堆转储,您可以将软件包名称直接传递给 am dumpheap。如需运行此命令,您必须使用 <profileable android:shell="true"/> 或 <debuggable> 构建应用。
# 1. Trigger the dump (the command takes a moment to complete):
adb shell am dumpheap -g -b png com.android.memorylab /data/local/tmp/heap.hprof

# 2. Pull the file to your development machine:
adb pull /data/local/tmp/heap.hprof .
使用 Perfetto
Perfetto 还可以通过在 Perfetto 配置中启用 android.java_hprof 数据源来捕获 Java 堆转储,作为系统级跟踪的一部分。这对于将堆状态与其他系统事件相关联非常有用。
如需使用 Perfetto 为 MemoryLab 应用捕获堆转储,您可以使用以下命令:
# Create a temp file for the configuration
cat > /tmp/java_heap.pbtx <<EOF
data_sources: {
    config {
        name: "android.java_hprof"
        java_hprof_config {
            process_cmdline: "com.android.memorylab"
        }
    }
}
EOF

# Run trace command referencing the file
external/perfetto/tools/record_android_trace -o java_heap.perfetto-trace \
  -t 10s -c /tmp/java_heap.pbtx
使用 AHAT 进行分析
AHAT(Android 堆分析工具)是建议用于在网络浏览器中查看 .hprof 文件的工具。
开始 AHAT
如果您已在路径中安装 ahat,请使用以下命令启动它:
ahat heap.hprof
或者运行独立 jar:
java -jar ahat.jar heap.hprof
然后,在浏览器中打开 http://localhost:7100。
如需详细了解如何获取或构建 AHAT,请参阅 AHAT 源代码库。
关键分析工作流程
查找泄漏
在分配视图中搜索您的 Activity 类 (MainActivity)。
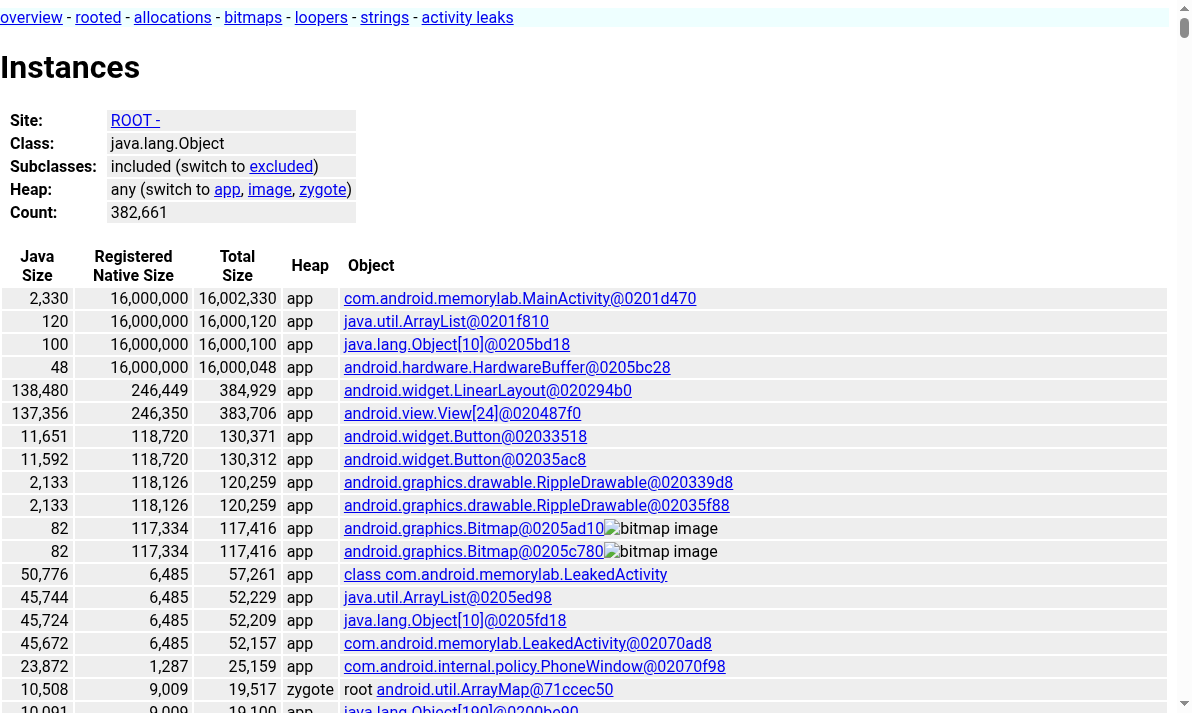
点击相应课程即可查找所有实例。
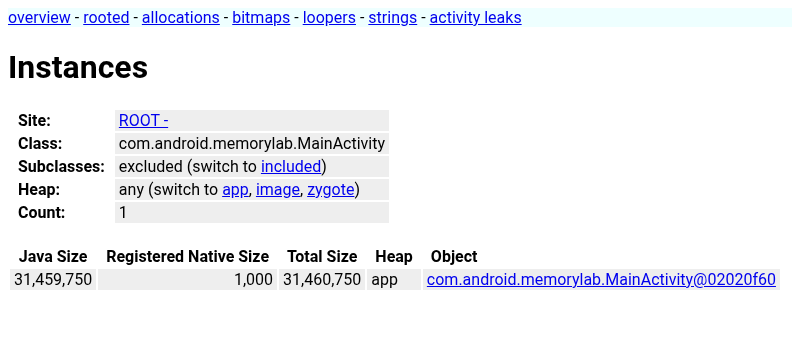 点击
点击 MainActivity 实例即可检查该实例。
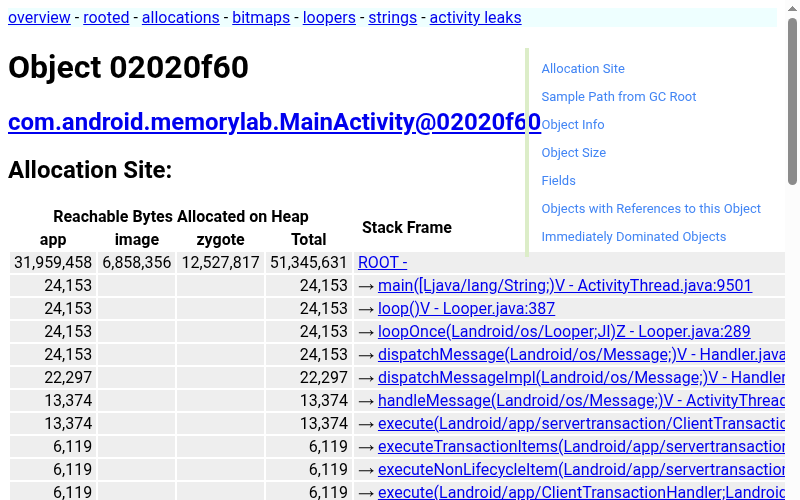
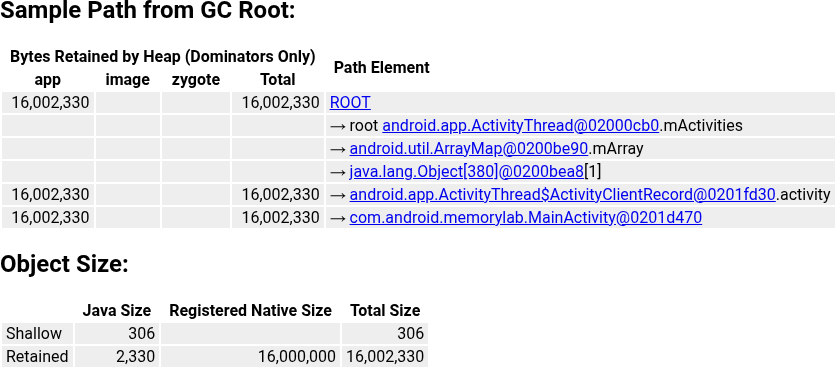
在实例视图中,您可以找到 Sample Path from GC Root(从 GC 根的示例路径),其中显示了阻止对象被垃圾回收的引用链;还可以找到 Object Size(对象大小),其中显示了此特定实例保留的内存量。
分析位图
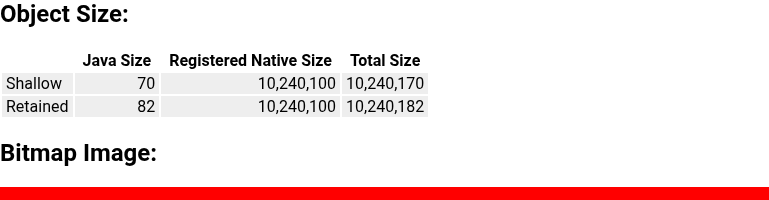
AHAT 特别支持查看 android.graphics.Bitmap 对象,这些对象通常会消耗大量内存。点击某个位图实例即可查看其内容的渲染预览。
“活动泄露”页面
AHAT 具有专门用于识别泄漏 Activity 的视图,泄漏 Activity 是 Android 中最常见且影响最大的内存泄漏之一。
- 操作:在 MemoryLab 中,点按 Leak an Activity。此命令会启动故意泄露自身的
LeakedActivity。 - 转储:获取堆转储。
- 分析:点击 AHAT 边栏中的活动泄露。
- 验证:AHAT 会将
com.android.memorylab.LeakedActivity列为泄漏,因为其mDestroyed字段为 true(表示 Activity 生命周期已结束),但仍可从 GC 根访问。

对堆转储进行差异比较
比较两个堆转储是发现内存问题的最有效方法之一。通过将“干净”的基准转储与执行某些操作后获取的转储进行比较,您可以立即看到哪些对象已累积。
练习:通过差异比较识别泄漏
基准:启动 MemoryLab 并获取基准堆转储:
adb shell am dumpheap com.android.memorylab /data/local/tmp/base.hprof adb pull /data/local/tmp/base.hprof .操作:在应用中多次点按 Allocate Java Memory(10MB)。
最终:再获取一次堆转储:
adb shell am dumpheap com.android.memorylab /data/local/tmp/leaked.hprof adb pull /data/local/tmp/leaked.hprof .比较:启动 AHAT,将第二个转储作为主要转储,将第一个转储作为基准转储:
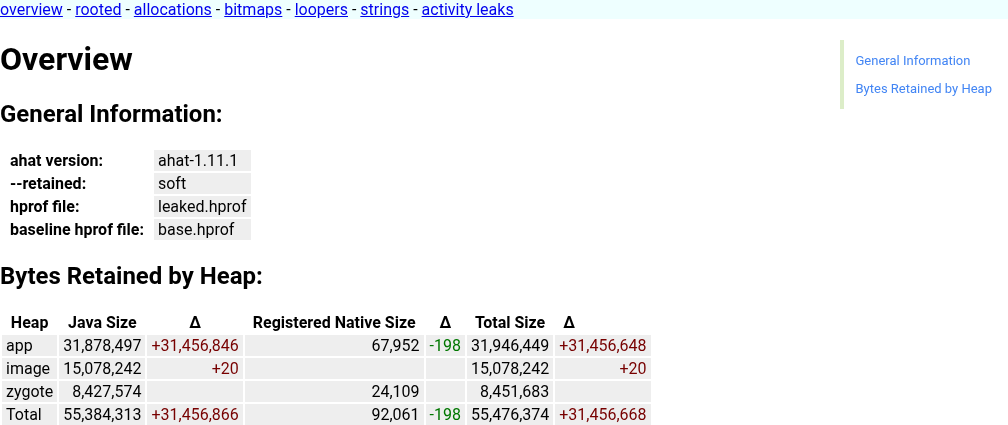
java -jar out/host/linux-x86/framework/ahat.jar leaked.hprof --baseline base.hprof分析概览:概览页面现在包含 Δ(增量)列。您会看到
app堆有较大的正增量,表明内存增长显著。
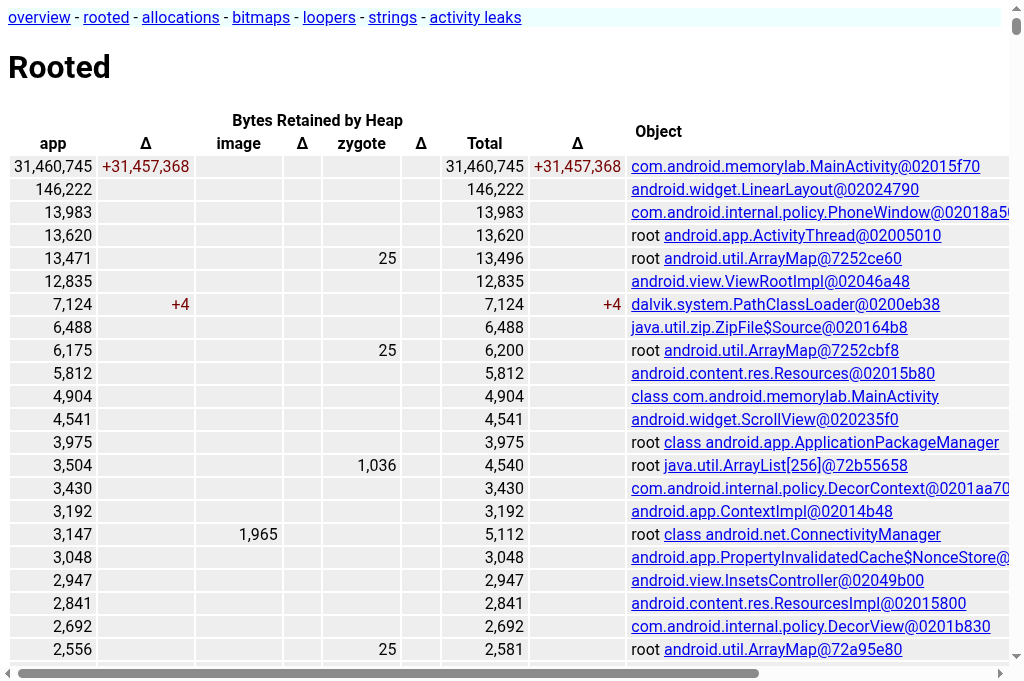
- 下钻:点击菜单中的 rooted。此页面会显示可从 GC 根访问的对象,并按其保留大小排序。您会在顶部看到
MainActivity,其中包含较大的正增量。
记录分配堆栈轨迹
虽然 Sample Path from GC Root 会告诉您对象仍然处于活动状态的原因,但不会告诉您对象的创建方式。分配堆栈轨迹可提供分配对象的精确代码行。
概念和权衡:记录每次分配的堆栈轨迹在计算上非常耗费资源,并且会消耗大量内存。在大型正式版应用中,这可能会导致应用几乎无法使用。不过,MemoryLab 是一款足够小的应用,我们可以放心地启用此跟踪功能,以精确定位分配的来源。
练习:确定字节数组的来源
从跟踪开始:强制停止 MemoryLab,然后使用
--track-allocation标志重新启动它。增加默认堆栈深度,以捕获更多上下文。# Increase the allocation tracker's stack depth (requires a process restart) adb shell setprop dalvik.vm.allocTrackerMaxStack 16 adb shell am force-stop com.android.memorylab adb shell am start --track-allocation -n com.android.memorylab/.MainActivity操作:点按分配 Java 内存(10MB) 几次。
转储:获取堆转储并拉取。
分析:在 AHAT 中打开转储。导航到大型
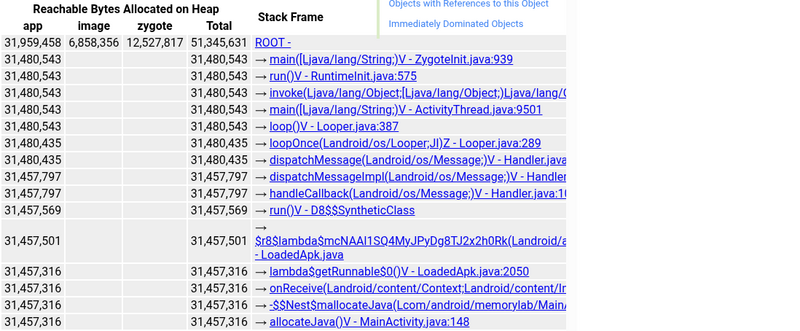
byte[]实例。 (例如,检查MainActivity→mJavaAllocations(ArrayList) →elementData(Object[]) → 数组元素[0])。验证:在实例视图中,查看分配网站部分。 它将显示导致
MainActivity.allocateJava的完整堆栈轨迹。
查找重复字符串和水合膨胀
即使应用没有经典的 GC-root 泄漏,其实时 Java 堆也可能会因在 JSON、Protobuf、Cursor 或 Room 数据库反序列化期间创建的数千个重复 java.lang.String 实例而变得臃肿。重复的键、状态字符串、类别标签或网址通常会在每次网络响应或数据库查询时重新分配。在大型 Feed、即时通讯和内容应用中,重复字符串通常占实时 String 内存的 30% 到 60%。
如需在 AHAT 中检查重复字符串,请执行以下操作:
- 打开分配页面,然后按
java.lang.String进行过滤。 - 使用
--baseline比较两个堆转储时,请检查在对 Feed 进行序列化或加载本地缓存后,java.lang.String实例数和总字节数是否不成比例地增长。 - 浏览
java.lang.String实例表(按大小或值排序),找出在多个内存中模型对象中保留的相同字符串值。
- 补救措施:避免在任意用户或网络输入上随意调用
String.intern(),因为运行时内部字符串池是全局的,可能会导致锁争用或保留字符串的时间过长。相反,您可以使用有界范围的去重缓存(例如解析器或适配器中的LruCache<String, String>)在反序列化期间对高频网域字符串进行去重,或者将固定的值集表示为枚举或整数常量。
分析 Java 内存动态(组合分析)
如需全面了解应用的内存行为,您可以将内存计数器、线程 activity 和基于调用堆栈的分配分析整合到单个 Perfetto 轨迹中。这样,您就可以将系统范围内的内存指标(如 RSS 和堆大小)与特定的代码执行和分配位置相关联。
我们将使用一种组合配置,该配置可实现以下功能:
- 内存计数器 (
linux.process_stats):轮询 RSS 和其他内存指标。 - ATrace(
dalvik、memory、sched类别):捕获线程状态和 GC 事件。 - Heapprofd (
android.heapprofd):以 5 秒为间隔持续转储,同时针对com.android.art(Java) 和libc.malloc(原生)堆。
练习:组合内存分析
在此练习中,我们将运行 MemoryLab 应用并执行一系列内存操作,以观察轨迹中的不同模式:
- 基准:空闲状态。
- Java 抖动:立即进行垃圾回收的临时分配。
- 持久 Java 分配:分配保留在内存中的 Java 对象。
- 位图分配:分配大型图形资源(位于原生堆/显存中)。
- 回收:释放所有已分配的资源。
1. 发布和准备
强制停止并重启应用,以确保状态干净:
adb shell am force-stop com.android.memorylab
adb shell am start -W -n com.android.memorylab/.MainActivity
2. 开始跟踪并触发序列
我们将开始 40 秒的轨迹记录,并使用 am
broadcast 命令触发内存事件。
开始跟踪:
adb shell perfetto -c - --txt -o /data/misc/perfetto-traces/java_memory.perfetto-trace <<EOF buffers: { size_kb: 131072 fill_policy: RING_BUFFER } data_sources: { config { name: "linux.process_stats" target_buffer: 0 process_stats_config { scan_all_processes_on_start: true proc_stats_poll_ms: 100 } } } data_sources: { config { name: "linux.ftrace" target_buffer: 0 ftrace_config { ftrace_events: "sched/sched_switch" ftrace_events: "task/task_newtask" ftrace_events: "task/task_rename" ftrace_events: "ftrace/print" atrace_categories: "dalvik" atrace_categories: "am" atrace_categories: "res" atrace_categories: "memory" atrace_categories: "sched" atrace_apps: "com.android.memorylab" } } } data_sources: { config { name: "android.heapprofd" target_buffer: 0 heapprofd_config { sampling_interval_bytes: 4096 process_cmdline: "com.android.memorylab" heaps: "libc.malloc" heaps: "com.android.art" shmem_size_bytes: 8388608 block_client: true continuous_dump_config { dump_phase_ms: 1000 dump_interval_ms: 5000 } } } } duration_ms: 40000 EOF触发序列(在轨迹运行期间,在主机终端中运行以下命令,并遵循建议的时间):
# Wait ~5s for trace initialization, then start Java churn:
adb shell am broadcast -a com.android.memorylab.CHURN_JAVA

# Wait ~10s (at 15s mark), allocate 10MB of persistent Java memory:
adb shell am broadcast -a com.android.memorylab.ALLOC_JAVA

# Wait ~5s (at 20s mark), allocate 20MB of Bitmaps (native/graphics):
adb shell am broadcast -a com.android.memorylab.LEAK_BITMAP

# Wait ~10s (at 30s mark), free everything:
adb shell am broadcast -a com.android.memorylab.FREE_ALL
替代方案 (CLI 工具):您还可以使用
heap_profile脚本直接启动分析,通过连续转储同时针对 Java 堆和原生堆:external/perfetto/tools/heap_profile -n com.android.memorylab \ --heaps com.android.art,libc.malloc \ -c 5000 \ -d 40000 \ -o java_memory_profile
3. 分析合并后的轨迹
在 Perfetto 界面中打开收集的 java_memory.perfetto-trace。
Perfetto 中的关键轨道
在分析时间轴之前,请找到以下与com.android.memorylab流程相关的重要轨道:
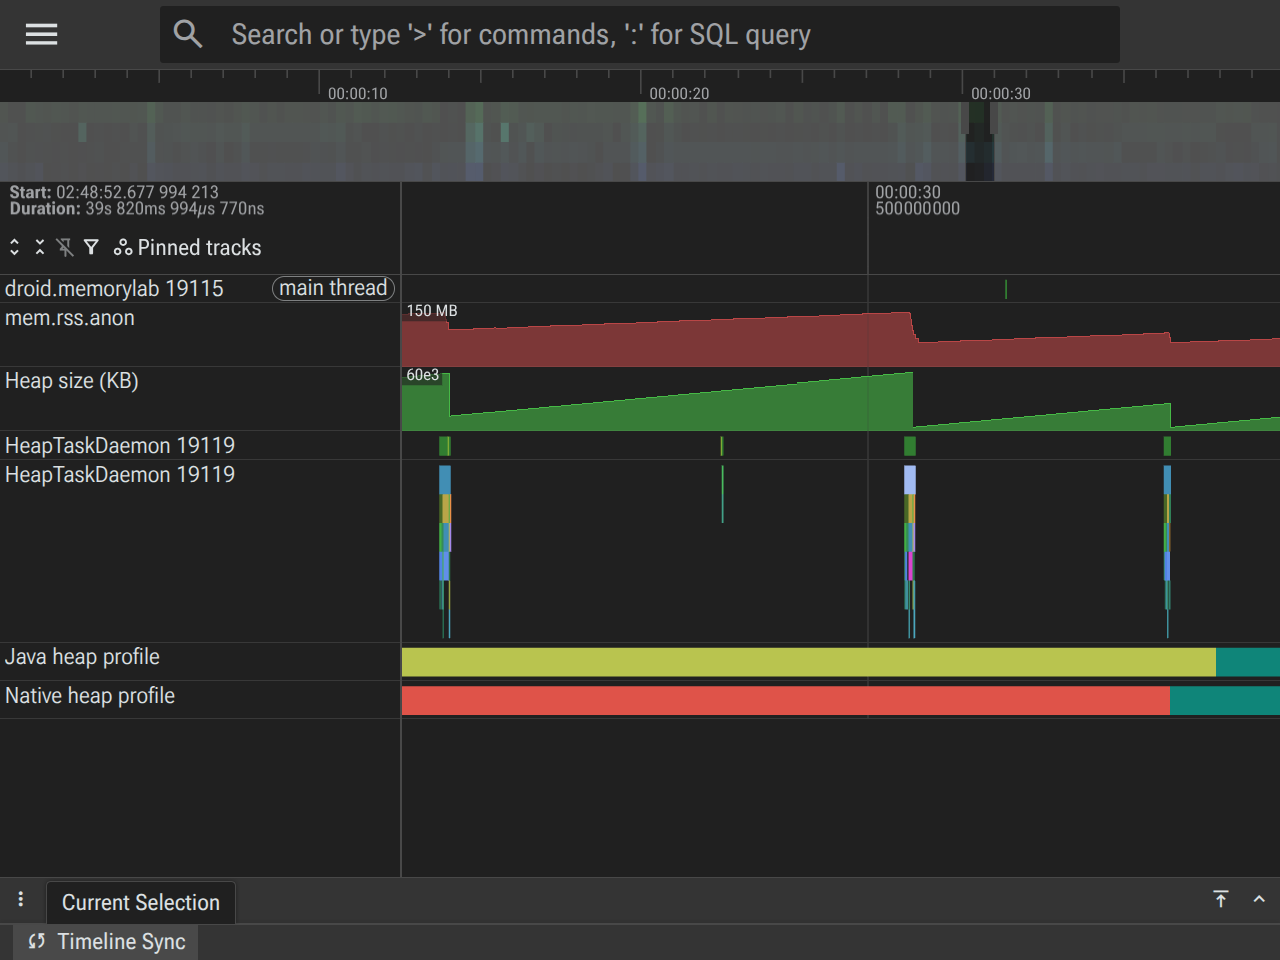
mem.rss.anon(匿名 RSS):位于进程的内存部分下。此轨道用于衡量操作系统分配给进程的物理内存 (RAM)。它表示实际的内存占用量。Heap size (KB):也位于内存部分下。这是一个特定于 Dalvik/ART 的计数器,表示为 Java 堆预留的虚拟地址空间。它反映了虚拟机的内部堆限制,该限制会随着对象的分配和垃圾回收的运行而波动。HeapTaskDaemon:可在进程下的线程列表中找到。这是 ART 垃圾收集器执行大部分工作的后台线程。此处的 activity 表示活跃的垃圾收集过程。- 连续分配内存转储 (heapprofd):显示为沿顶部时间轴的彩色切片。每个切片代表一段时间。点击单个切片或选择时间范围后,您可以在底部窗格中检查 Flamegraph,了解 com.android.art(Java 分配)或 libc.malloc(原生分配)在相应时间段内分配了哪些内容。
按时间顺序分析阶段
让我们按时间顺序查看轨迹,了解这些轨道在练习的每个阶段是如何互动的。
第 1 阶段:基准(0 秒 - 5 秒)
- 发生的情况:应用处于空闲状态,等待命令。
- 轨道状态:
mem.rss.anon:基准水平线(通常约为 60-80MB,具体取决于设备)。Heap size (KB):平线,与初始 Java 堆分配量相匹配。HeapTaskDaemon:空闲(没有显示执行的切片)。- 分配内存转储:显示最少的基准分配。
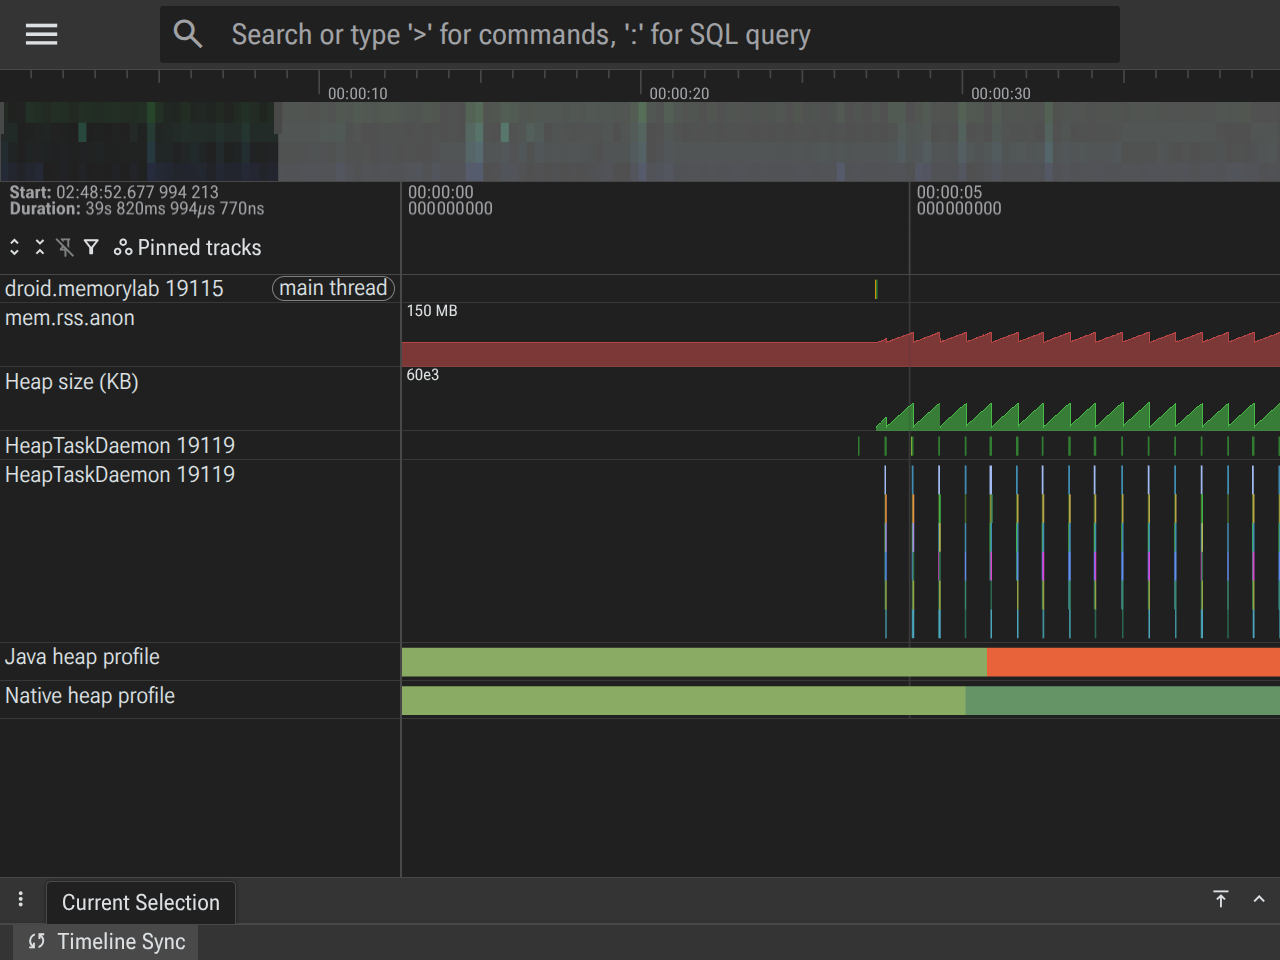
第 2 阶段:Java 分配抖动(5 秒 - 15 秒)
- 发生的情况:
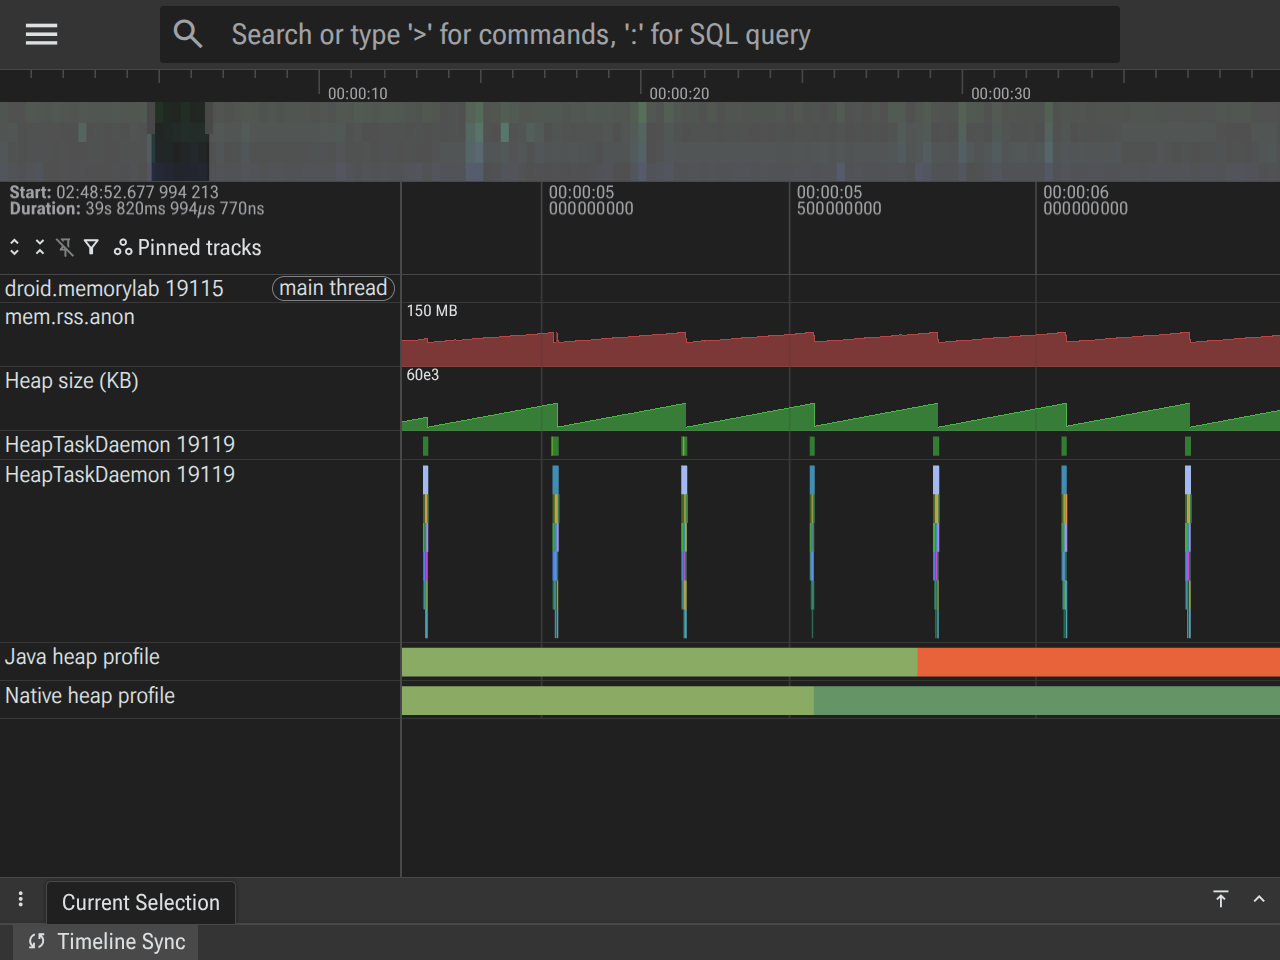
AllocationChurnThread已启动,反复分配 1MB 数组并将其舍弃。 - 轨道状态:
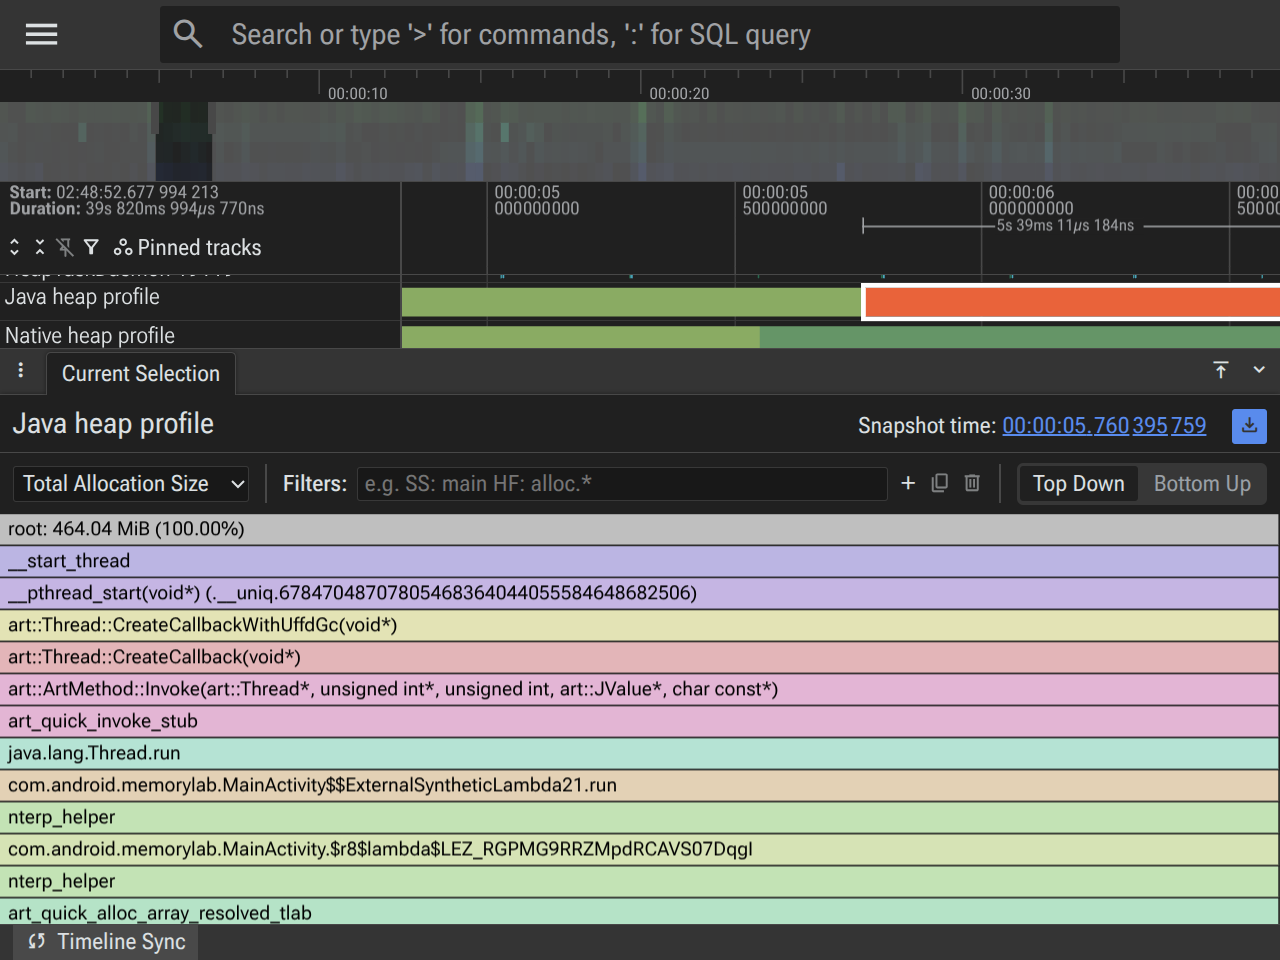
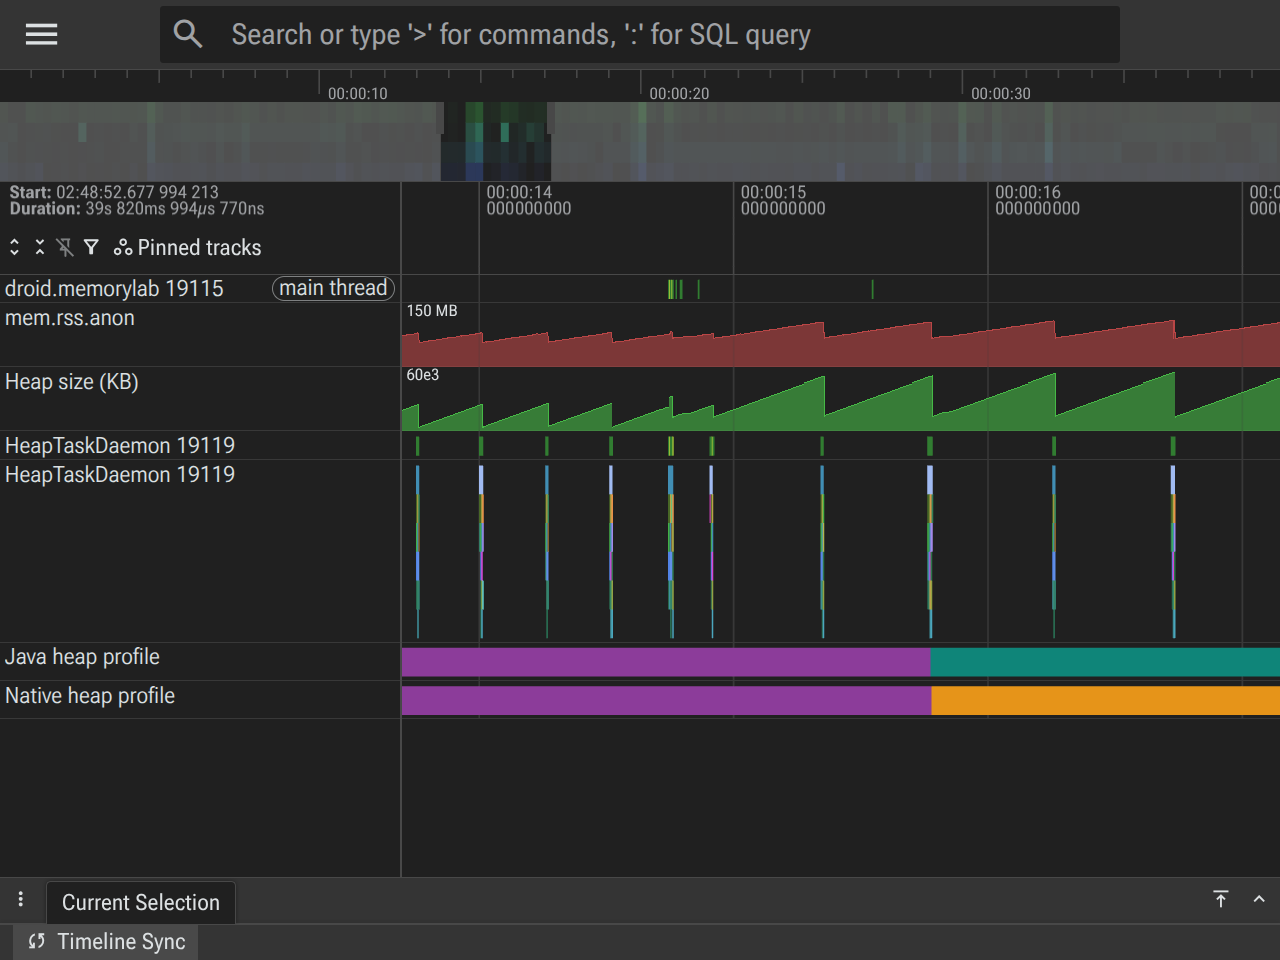
Heap size (KB):显示快速的锯齿状模式。堆大小会随着分配的累积而增加,并在 GC 运行时急剧下降。HeapTaskDaemon:显示近乎恒定的 activity,执行切片与Heap size锯齿的下降部分完全对齐。mem.rss.anon:跟踪 Java 堆活动。- Java 堆分配转储:选择此轨道中的切片会显示 com.android.art 堆分配。
 分配样本显示
 AllocationChurnThread 是主要分配器,所有分配都共享指向 MainActivity.java 内 lambda 的同一调用堆栈。
第 3 阶段:持久 Java 分配(15 秒 - 20 秒)
- 发生的情况:我们分配了 10MB 的 Java 对象,并在
mJavaAllocations中保留了对这些对象的引用。 - 轨道状态:
Heap size (KB):锯齿状台阶的基准值大约增加 10MB。mem.rss.anon:大约增加 10 MB,因为操作系统必须使用新的物理页面来支持此持久分配。- Java 堆分配转储:选择此轨道中的切片会显示 com.android.art 堆分配。
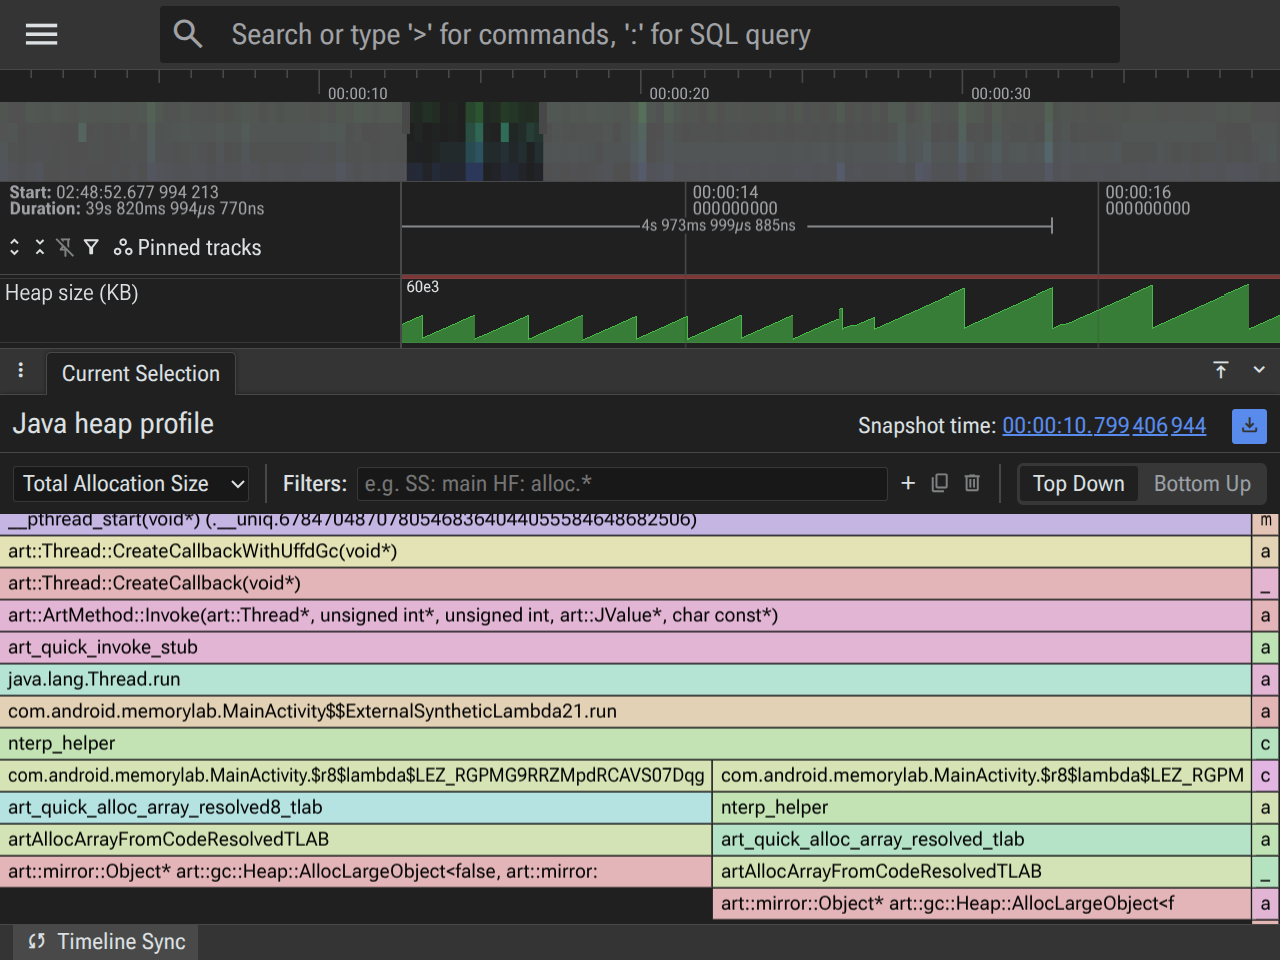
- 分配内存转储(火焰图):检查此窗口中获取的转储的 com.android.art 堆,发现
MainActivity.allocateJava的新分配路径导致保留大小增加。
 选择一个分配样本,该样本涵盖的持续时间与永久性分配的 10MB 增幅重叠。您应该会看到分配调用堆栈分叉到两个不同的位置,一个负责之前看到的相同短期分配 churn,另一个负责新的长期分配。
第 4 阶段:位图分配(20 秒 - 30 秒)
- 发生了什么:我们还分配了 20MB 的位图。
- 轨道状态:
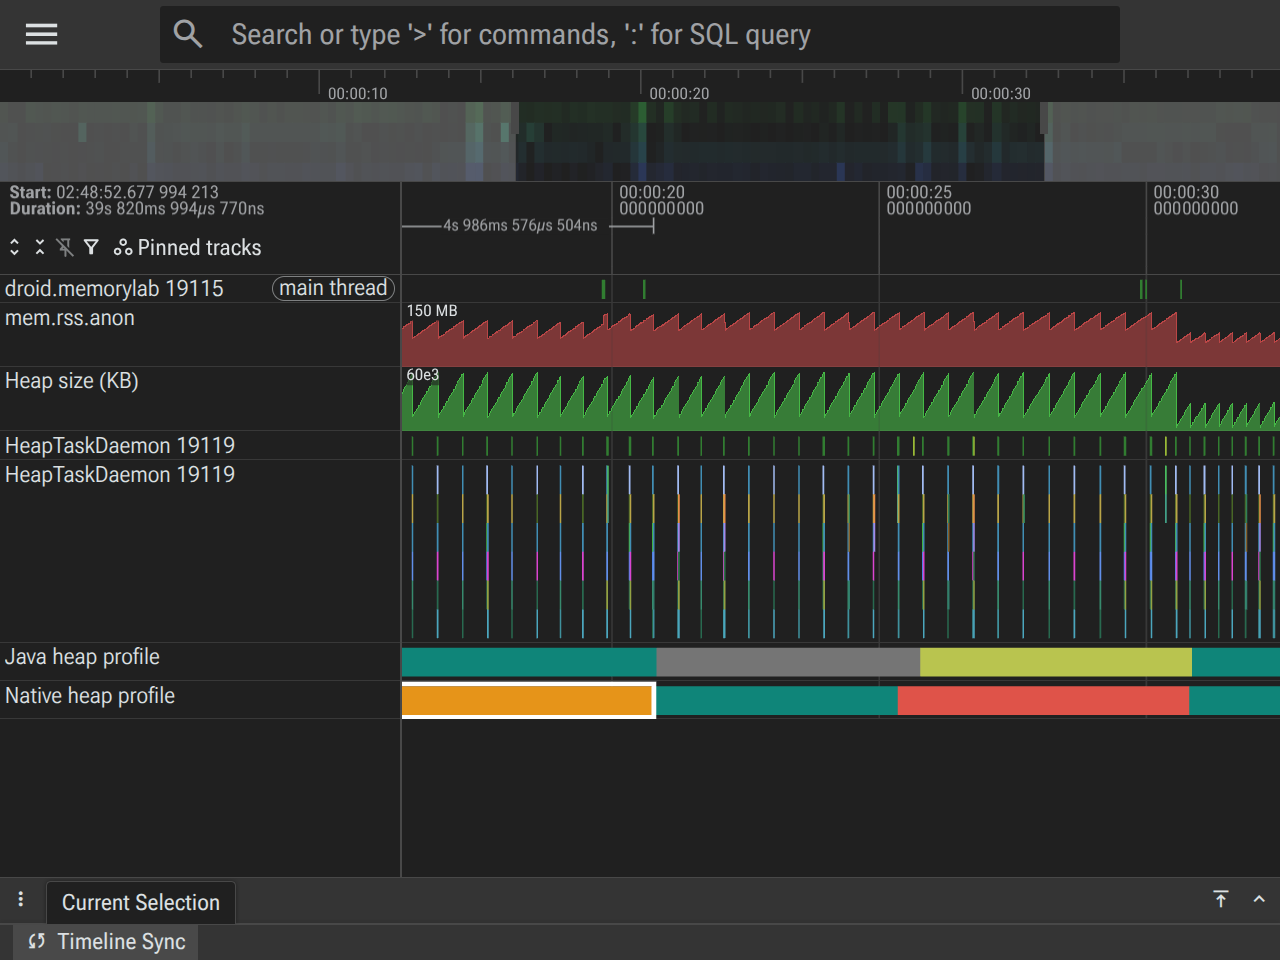
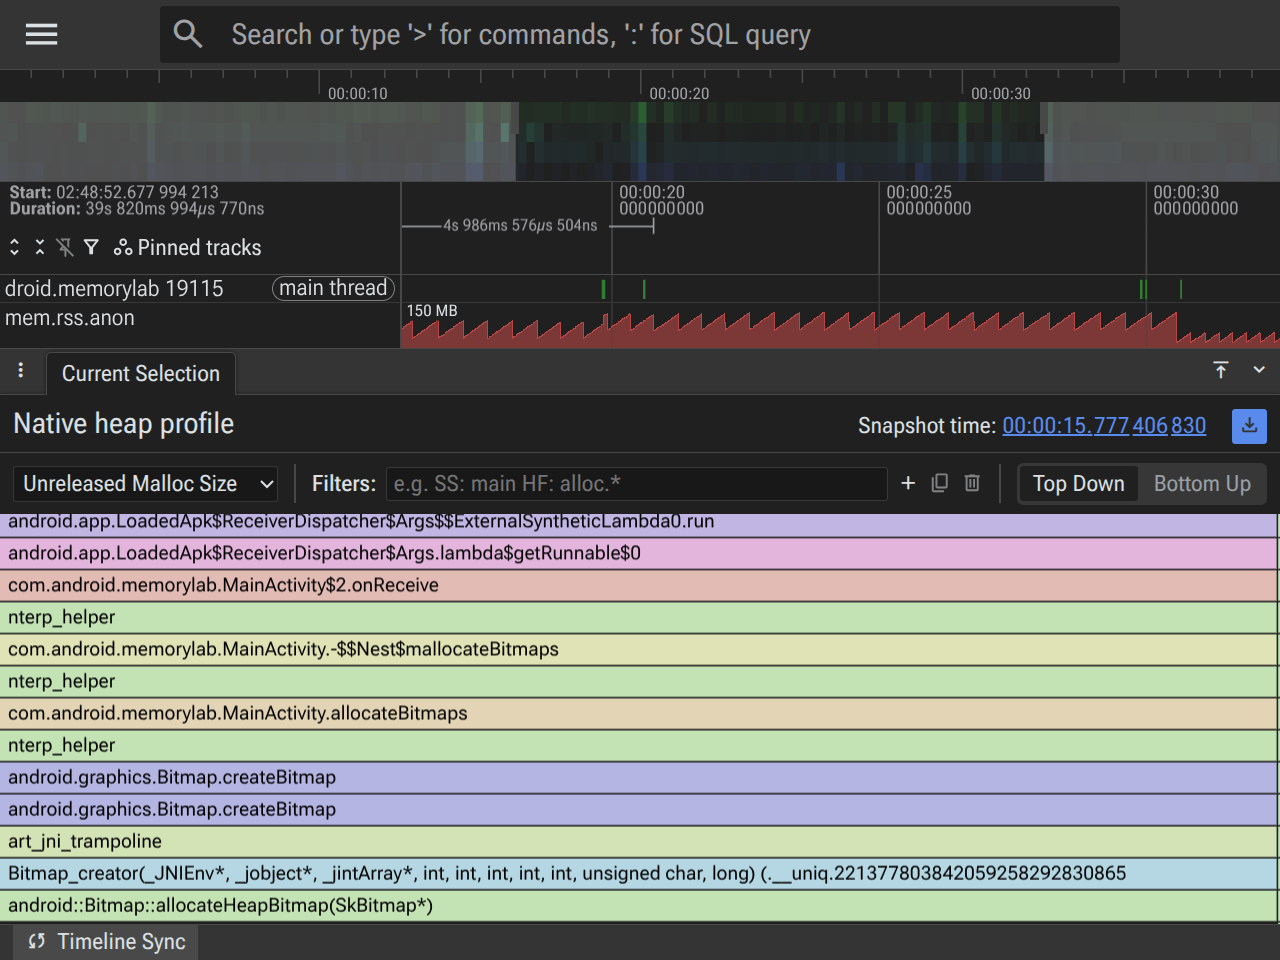
Heap size (KB):与之前相同。mem.rss.anon:显示了大约 20MB 的显著增幅,这与位图像素数据的原生分配相对应。- 分配转储(火焰图):这次重点关注 libc.malloc(原生)堆的切片。
 原生分配调用栈显示了源自原生图形库的位图分配。这是一个适合使用原生分配跟踪的应用场景,因为您不会在 Java 堆中看到这些位图分配。
第 5 阶段:回收(30 秒 - 40 秒)
- 发生的情况:我们触发
FREE_ALL,清除对所有持久性 Java 分配和位图的引用,然后显式调用System.gc()。 - 轨道状态:
Heap size (KB):降回基准水平。mem.rss.anon:降回较低水平,表明操作系统正在回收物理内存页。HeapTaskDaemon:显示在处理垃圾回收时出现的最终活动爆发。
监控历史 OOM(ApplicationExitInfo)
在 LMK 发生时捕获它非常适合主动调试,但对于现场遥测,您可以使用 ApplicationExitInfo API。这样,您的应用就可以发现它在之前的会话中被终止的原因。
ActivityManager am = getSystemService(ActivityManager.class);
List<ApplicationExitInfo> exitReasons = am.getHistoricalProcessExitReasons(null, 0, 1);
if (!exitReasons.isEmpty()) {
    ApplicationExitInfo info = exitReasons.get(0);
    if (info.getReason() == ApplicationExitInfo.REASON_LOW_MEMORY) {
        // App was killed by the system Low Memory Killer
    }
}
最佳做法
- 先进行基准测试:始终在应用初始化后但在执行要测试的操作之前,获取“基准”堆转储。
- 使用 AHAT 的“Activity Leaks”页面:AHAT 包含一个专门的 Activity Leaks 页面,可自动识别已销毁但仍保留在内存中的 Activity 实例。这通常是查找常见漏液的最快方法。
- 检查通往 GC 根的路径:对于任何泄漏的对象,请使用 AHAT 中的从根开始的路径视图,准确了解哪个引用使其保持活动状态(例如,静态字段、长时间运行的线程或已注册的监听器)。