

在前面的部分中,我们了解了内核如何在系统范围内管理内存。在本章中,我们将深入探讨 内存控制组 (memcg),这是 Android 用于为各个应用划分和控制内存用量的机制。
了解 memcg 至关重要,因为系统可以在此级别针对单个应用进行回收或设置内存限制,从而主动管理应用内存占用空间。
内存控制组 (memcg)
控制组 (cgroup) 是一项 Linux 内核功能,可将进程组织成分层组,并在这些组之间分配系统资源(如 CPU、内存和 I/O)。memcg 是专门用于内存的 cgroup 控制器。
关键的 memcg 概念
- Memcg Charge:当 memcg 中的进程分配内存页(匿名或文件支持)时,该内存页会“计入”memcg。内存控制组的总费用是其中所有进程使用的所有内存页的总和。
- 分层统计:内存用量会向上统计到树中。子 cgroup 中的费用也会计入其父 cgroup 的使用量。
- 内存限制:每个 memcg 都可以设置限制(例如
memory.max或memory.high),如果超出限制,则会触发回收甚至 OOM Killer,而与全局系统内存无关。 - 按 memcg 回收:当某个 memcg 超出其限制或系统需要内存时,内核可以针对特定 memcg 进行回收。这意味着要逐出其文件页或将其匿名页交换到 ZRAM。
Android memcg 层次结构
Android 使用特定的层次结构来管理应用进程。此结构可让系统针对不同类型的应用(例如前台应用与后台应用)应用不同的政策。
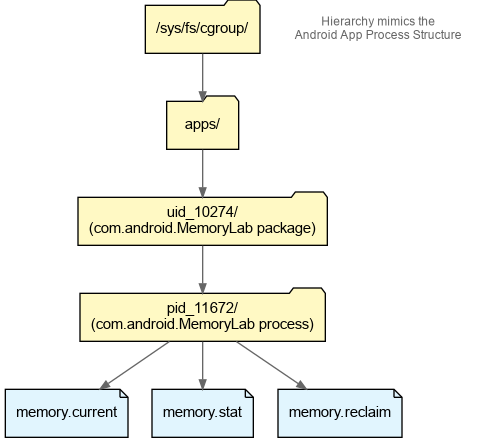
/sys/fs/cgroup/apps/:所有 Android 应用的根。uid_<UID>/:每个应用的用户 ID 对应的目录。属于同一应用包的所有进程共享此组。pid_<PID>/:每个进程及其派生的任何子进程的目录。这样可以对具有多个进程的应用进行精细控制和结算。
实操练习:探索 memcg
在本练习中,您将找到 MemoryLab 的 memcg 目录,并实时观察其内存费用。
1. 启动 MemoryLab
确保 MemoryLab 在设备上运行。
2. 查找 MemoryLab 的 memcg
首先,获取正在运行的 MemoryLab 应用的 PID:
adb shell pidof com.android.memorylab
# Example output: 11672
现在,找到其 cgroup 目录。您可以在 /proc/<PID>/cgroup 中找到此信息:
adb shell cat /proc/11672/cgroup
# Example output: 0::/apps/uid_10274/pid_11672
在 cgroup v2 中,0:: 后面的路径表示相对于 /sys/fs/cgroup 的 memcg 层次结构。因此,完整路径为 /sys/fs/cgroup/apps/uid_10274/pid_11672/。
3. 读取 memcg 统计信息
进入该目录并查看密钥文件:
# Current memory usage (in bytes)
adb shell cat /sys/fs/cgroup/apps/uid_10274/pid_11672/memory.current
# Example output:
# 1591324672
memory.current 显示当前向相应 cgroup 收取的内存总量(以字节为单位)。
# Detailed statistics
adb shell cat /sys/fs/cgroup/apps/uid_10274/pid_11672/memory.stat | head -n 10
# Example output:
# anon 1585098752
# file 741376
# kernel 5484544
# kernel_stack 393216
# pagetables 4583424
# sec_pagetables 0
# percpu 216
# sock 0
# vmalloc 4096
# shmem 20480
memory.stat 提供细分信息:* anon:匿名内存(堆、栈)量。* file:文件支持的内存量(页面缓存)。*
swap:换出到 ZRAM 的内存量。
4. 观察变化
- 打开 MemoryLab。
- 记下
memory.current的值。 - 多次点按 Allocate Java Memory (10MB)。
- 再次阅读
memory.current。您应该会看到它每次点按增加约 10MB。 - 点按 Allocate Bitmaps。查看
memory.stat,了解anon增加情况。
使用 memory.reclaim 进行主动回收
memcg (v2) 的一项强大功能是 memory.reclaim 文件。向此文件写入值会指示内核立即尝试从该 memcg 及其下的任何 memcg 回收相应数量的内存。
Android 如何使用 memory.reclaim
Android 的 CachedAppOptimizer 使用此功能在应用被冻结后尽可能多地回收内存。Android 应用冻结器可确保缓存的应用在未运行时尽可能少地消耗 RAM。当应用移至后台并被冻结时,系统会将应用的当前内存用量写入其 memory.reclaim 文件。这会强制内核逐出所有可能的文件页面,并将所有匿名页面交换到 ZRAM,从而最大限度地减少应用的常驻内存占用空间。
您可以通过读取 memory.current 并将其写回 memory.reclaim 来手动实现相同的“最大回收”:
# Force reclaim of everything
adb shell "cat /sys/fs/cgroup/apps/uid_10274/pid_11672/memory.current > /sys/fs/cgroup/apps/uid_10274/pid_11672/memory.reclaim"
练习:强制回收和跟踪
现在,我们将强制内核从 MemoryLab 回收内存,并在 Perfetto 轨迹中捕获该活动。
- 准备:确保 MemoryLab 有一些分配(Java 和位图)。
开始跟踪:使用此内嵌跟踪配置可捕获调度、回收和页面缓存事件。
# Use a config that captures scheduling, reclaim and page cache events adb shell perfetto -c - --txt -o /data/misc/perfetto-traces/reclaim.perfetto-trace <<EOF buffers: { size_kb: 131072 fill_policy: RING_BUFFER } data_sources: { config { name: "linux.ftrace" ftrace_config { ftrace_events: "sched/sched_switch" ftrace_events: "sched/sched_wakeup" ftrace_events: "kmem/rss_stat" ftrace_events: "mm_filemap_add_to_page_cache" ftrace_events: "mm_filemap_delete_from_page_cache" ftrace_events: "vmscan/mm_vmscan_direct_reclaim_begin" ftrace_events: "vmscan/mm_vmscan_direct_reclaim_end" ftrace_events: "vmscan/mm_vmscan_memcg_reclaim_begin" ftrace_events: "vmscan/mm_vmscan_memcg_reclaim_end" symbolize_ksyms: true } } } data_sources: { config { name: "linux.process_stats" process_stats_config { scan_all_processes_on_start: true } } } EOF触发压力和回收:
- 在 MemoryLab 中,点按 Allocate Native Memory (1GB)。这会触发系统范围内的压力。
在单独的终端中,回收 200MB:
adb shell "echo 200M > /sys/fs/cgroup/apps/uid_10274/pid_11672/memory.reclaim"
故障恢复:切换回 MemoryLab。点按 Thrash Pagecache(重新错误测试)。
停止轨迹:在轨迹终端中按 Ctrl+C。
在 Perfetto 中分析回收
打开轨迹后,您可以看到系统范围和每个应用的回收操作:
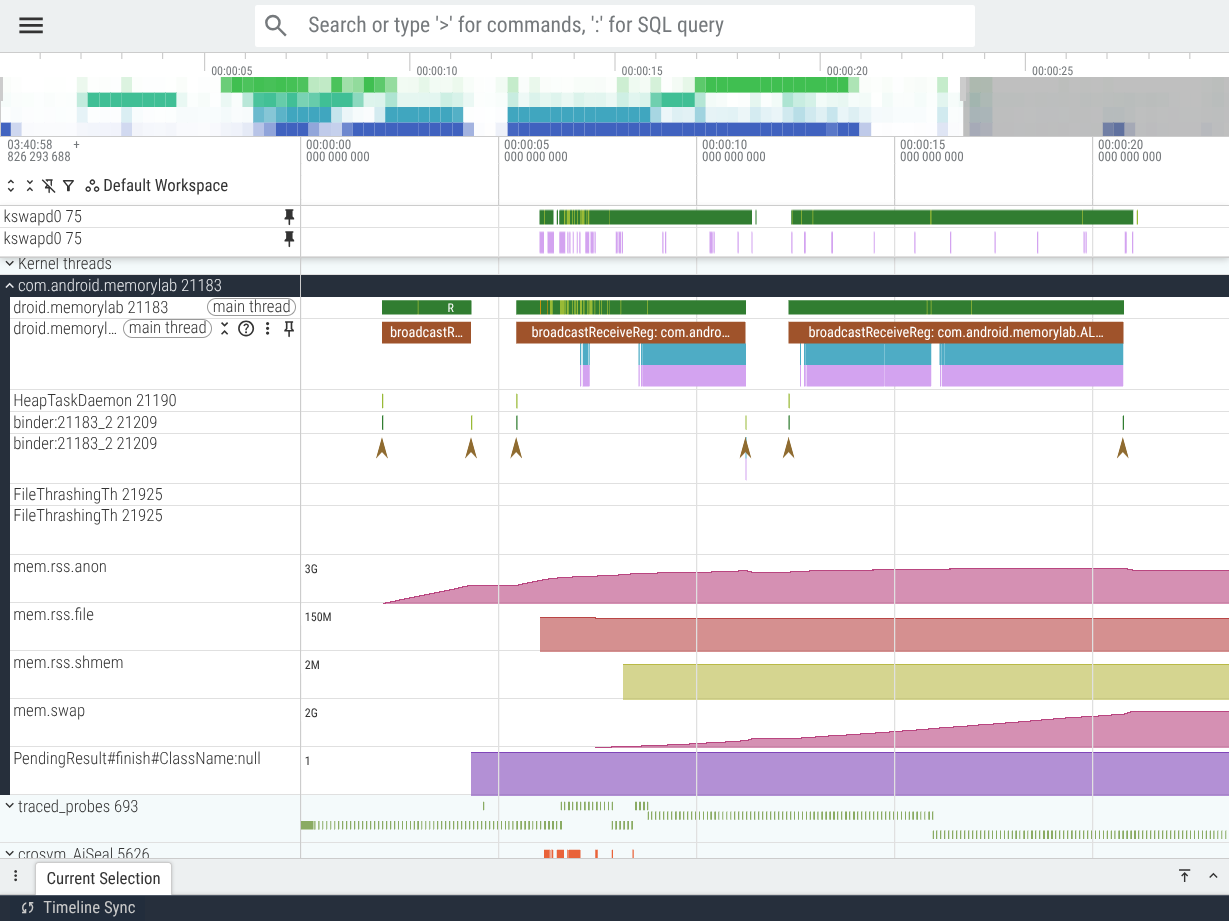
在轨迹中查找以下内容:
- kswapd:在内核线程下搜索
kswapd0(在上面的屏幕截图中,它被手动固定在顶部)。您会看到,当系统难以找到空闲页面时,它会唤醒并运行(绿色切片)。 - 直接回收:查看
com.android.memorylab进程线程。 您会看到紫色 ftrace 事件切片(例如mm_vmscan_direct_reclaim_begin)直接显示在线程的调度轨道下方。这表示应用线程本身因等待内核释放页面而停滞。 - RSS 和交换计数器:
mem.rss.anon:随着您点按分配按钮而增加。mem.swap:随着kswapd和应用自己的线程(受直接回收影响)将这些匿名页面压缩到 ZRAM 中,该值会稳步增加。
- memcg 回收:如果您放大手动触发回收的那一刻,会看到
rss.anon和rss.file均急剧下降,同时伴有mm_vmscan_memcg_reclaim事件。
← 系统级 | ↑ 向上 | kswapd 和 lmkd 互动 →