
On Android 15 (API level 35) and higher, app-driven profiling lets your app
explicitly start and stop supported profile recordings in code using the
ProfilingManager API or AndroidX Core (androidx.core:core 1.15.0 or
higher) builders. Use direct profiling when you want to control profile timing
or session parameters—such as durations, buffer policies, and sampling rates—or
target a specific user journey or runtime condition.
Add dependencies
For the best experience with the ProfilingManager API, add the following
Jetpack libraries to your build.gradle.kts file.
Kotlin
   dependencies {
       implementation("androidx.tracing:tracing-ktx:2.0.5")
       implementation("androidx.core:core:1.19.1")
   }
Groovy
   dependencies {
       implementation 'androidx.tracing:tracing-ktx:2.0.5'
       implementation 'androidx.core:core:1.19.1'
   }
Record a system trace
After adding the required dependencies, use the following code to record a system trace. This example shows how to start a profiling session while safely managing heavy operations off the main thread.
Kotlin
@RequiresApi(Build.VERSION_CODES.VANILLA_ICE_CREAM) @Composable fun ProfiledScreen(modifier: Modifier = Modifier) { // Use the application context: requestProfiling resolves the ProfilingManager // system service from it, so there's no reason to hand it a short-lived Activity. val appContext = LocalContext.current.applicationContext val scope = rememberCoroutineScope() Button( onClick = { // Run the orchestration off the main thread. Profiling a heavy operation // on the UI thread would freeze the UI (ANR) and distort the very metrics // you're trying to capture. // // Note: this scope is tied to composition. If the user leaves this screen // mid-session, the coroutine is cancelled and stopSignal.cancel() might not // run, but setDurationMs() acts as a safety net and ends the profile. scope.launch(Dispatchers.Default) { val callbackExecutor = Dispatchers.IO.asExecutor() val resultCallback = Consumer<ProfilingResult> { profilingResult -> if (profilingResult.errorCode == ProfilingResult.ERROR_NONE) { Log.d("ProfileTest", "Result file: ${profilingResult.resultFilePath}") } else { // errorMessage explains the failure (e.g., rate limiting); keep it. Log.e( "ProfileTest", "Profiling failed errorCode=${profilingResult.errorCode} " + "errorMessage=${profilingResult.errorMessage}" ) } } val stopSignal = CancellationSignal() val requestBuilder = SystemTraceRequestBuilder().apply { setCancellationSignal(stopSignal) setTag("FOO") // Caller-supplied tag for identification. setDurationMs(60000) // Hard cap: ends the session if cancel() never fires. setBufferFillPolicy(BufferFillPolicy.RING_BUFFER) setBufferSizeKb(32768) } // 1. Start the session. This is asynchronous system IPC. The tracing // engine takes a moment to start and allocate buffers. requestProfiling(appContext, requestBuilder.build(), callbackExecutor, resultCallback) // 2. The API exposes no "profiling started" signal, so pad with a short, // best-effort delay before running the code you care about. This is // approximate. Increase it on slower or heavily loaded devices. delay(STARTUP_PADDING_MS) // 3. The session is already recording every thread in your app. This slice // doesn't scope what's captured. It just labels this region of the // timeline so heavyOperation() is easier to find. trace { } closes the // section even if the block throws. trace("MyApp:HeavyOperation") { heavyOperation() } // 4. Stop recording. Until this fires or the setDurationMs() cap is // reached (whichever comes first), the session keeps capturing app-wide // activity. stopSignal.cancel() } } ) { Text("Run & Profile Heavy Operation") } } // Best-effort wait for the system trace engine to initialize before profiling. // There is no deterministic start callback; tune this for your target devices. private const val STARTUP_PADDING_MS = 100L fun heavyOperation() { // Background computations to profile. }
Java
void sampleRecordSystemTrace(Context context) { // Use the application context: requestProfiling resolves the ProfilingManager // system service from it, so there's no reason to hand it a short-lived Activity. Context appContext = context.getApplicationContext(); // Run the orchestration off the main thread. Profiling a heavy operation // on the UI thread would freeze the UI (ANR) and distort the very metrics // you're trying to capture. profilingExecutor.execute(() -> { Executor callbackExecutor = Executors.newSingleThreadExecutor(); Consumer<ProfilingResult> resultCallback = profilingResult -> { if (profilingResult.getErrorCode() == ProfilingResult.ERROR_NONE) { Log.d("ProfileTest", "Result file: " + profilingResult.getResultFilePath()); } else { // errorMessage explains the failure (e.g., rate limiting); keep it. Log.e( "ProfileTest", "Profiling failed errorCode=" + profilingResult.getErrorCode() + " errorMessage=" + profilingResult.getErrorMessage()); } }; CancellationSignal stopSignal = new CancellationSignal(); SystemTraceRequestBuilder requestBuilder = new SystemTraceRequestBuilder(); requestBuilder.setCancellationSignal(stopSignal); requestBuilder.setTag("FOO"); // Caller-supplied tag for identification. requestBuilder.setDurationMs(60000); // Hard cap: ends the session if cancel() never fires. requestBuilder.setBufferFillPolicy(BufferFillPolicy.RING_BUFFER); requestBuilder.setBufferSizeKb(32768); // 1. Start the session. This is asynchronous system IPC. The tracing // engine takes a moment to start and allocate buffers. Profiling.requestProfiling( appContext, requestBuilder.build(), callbackExecutor, resultCallback); // 2. The API exposes no "profiling started" signal, so pad with a short, // best-effort delay before running the code you care about. This is // approximate. Increase it on slower or heavily loaded devices. try { Thread.sleep(STARTUP_PADDING_MS); } catch (InterruptedException e) { Thread.currentThread().interrupt(); stopSignal.cancel(); return; } // 3. The session is already recording every thread in your app. This slice // doesn't scope what's captured. It just labels this region of the // timeline so heavyOperation() is easier to find. try/finally closes the // section even if heavyOperation() throws. Trace.beginSection("MyApp:HeavyOperation"); try { heavyOperation(); } finally { Trace.endSection(); } // 4. Stop recording. Until this fires or the setDurationMs() cap is // reached (whichever comes first), the session keeps capturing app-wide // activity. stopSignal.cancel(); }); } // Best-effort wait for the system trace engine to initialize before profiling. // There is no deterministic start callback; tune this for your target devices. private static final long STARTUP_PADDING_MS = 100L; // Single background thread that runs the profiling orchestration. private final ExecutorService profilingExecutor = Executors.newSingleThreadExecutor(); void heavyOperation() { // Background computations to profile. }
The sample code sets up and manages the profiling session in the following steps:
- Set up the executor: Create a non-UI
Executorto receive profiling results off the main thread. - Handle profiling results: Create a
Consumer<ProfilingResult>callback to receive the completed result or error fromProfilingManager. Build the profiling request: Create a
SystemTraceRequestBuilderto customize session settings (or omit customizations to use system defaults):setTag(): Attaches a caller-supplied tag that is returned byProfilingResult.getTagand appended to the output filename (up to the first 20 lowercase alphanumeric characters and hyphens).setDurationMs(): Sets the maximum recording duration in milliseconds (for example,60000for 60 seconds).setBufferFillPolicy(): Defines how the buffer handles capacity limits:BufferFillPolicy.RING_BUFFERoverwrites the oldest data when full, whereasBufferFillPolicy.DISCARDstops recording new data once the buffer is full.setBufferSizeKb(): Sets the recording buffer size in kilobytes.
Optional: Stop the recording early: Pass a
CancellationSignal(stopSignal) to stop the session as soon as the target operation finishes, saving the data recorded so far and delivering theProfilingResultto your callback. See Stop an active recording for details.Start and receive results: Call
requestProfiling()to start recording in the background. When the session ends,resultCallback.accept()receives aProfilingResult:- On success (
ERROR_NONE), callgetResultFilePath()to get the on-device path. For instructions on pulling files withadbor uploading them withWorkManager, see Retrieve and upload profiles. - On failure, inspect
getErrorCode()andgetErrorMessage(). Requests can fail due to rate limiting as well as several other reasons. - If your app terminates before the result is delivered, the system
queues the result and delivers it the next time your app registers a
global listener with
registerForAllProfilingResults.
- On success (
Add custom trace points: Wrap operations in
trace("...") { ... }(orTrace.beginSection()/Trace.endSection()) to label regions of the timeline.
Stop an active recording
To stop a capture as soon as an interaction completes rather than waiting for
setDurationMs() to expire, pass a CancellationSignal to
setCancellationSignal() or requestProfiling(). If you specify both
CancellationSignal and setDurationMs(), whichever happens first ends the
session; if you specify neither, the system applies a default duration.
Calling cancel() doesn't discard the recording. The system stops the capture,
redacts and saves the data collected up to that point, and delivers the
ProfilingResult to your listener with ERROR_NONE.
Record system traces with call stack sampling
On devices running Android 17 (API level 37) and higher (or Android 16 with an
updated Profiling mainline module), ProfilingManager supports collecting
sampled call stacks alongside a system trace in a single session so you can see
timeline events, such as thread states, frames, and custom trace slices,
together with CPU call stacks for methods without explicit trace
instrumentation.
This example also shows how to call ProfilingManager.requestProfiling
directly without Jetpack builders by specifying one of the supported profile
types (PROFILING_TYPE_SYSTEM_TRACE) and passing a configuration
Bundle:
Kotlin
val profilingManager = context.getSystemService(ProfilingManager::class.java) // Pass a Bundle to customize the capture, or pass null for default settings. val config = Bundle().apply { putInt("KEY_DURATION_MS", 15000) // 15 seconds putInt("KEY_SIZE_KB", 20480) // 20 MB buffer size // Collect sampled CPU call stacks alongside the system trace. putBoolean("KEY_COLLECT_STACK_SAMPLING", true) putInt("KEY_FREQUENCY_HZ", 100) // Sampling frequency in Hz // Optional: Set KEY_SAMPLE_BINDER_ONLY to true to sample only binder calls. } profilingManager?.requestProfiling( ProfilingManager.PROFILING_TYPE_SYSTEM_TRACE, config, "trace-with-callstacks", null, callbackExecutor, resultCallback )
Java
ProfilingManager profilingManager = context.getSystemService(ProfilingManager.class); if (profilingManager == null) return; // Pass a Bundle to customize the capture, or pass null for default settings. Bundle config = new Bundle(); config.putInt("KEY_DURATION_MS", 15000); // 15 seconds config.putInt("KEY_SIZE_KB", 20480); // 20 MB buffer size // Collect sampled CPU call stacks alongside the system trace. config.putBoolean("KEY_COLLECT_STACK_SAMPLING", true); config.putInt("KEY_FREQUENCY_HZ", 100); // Sampling frequency in Hz // Optional: Set KEY_SAMPLE_BINDER_ONLY to true to sample only binder calls. profilingManager.requestProfiling( ProfilingManager.PROFILING_TYPE_SYSTEM_TRACE, config, "trace-with-callstacks", null, callbackExecutor, resultCallback );
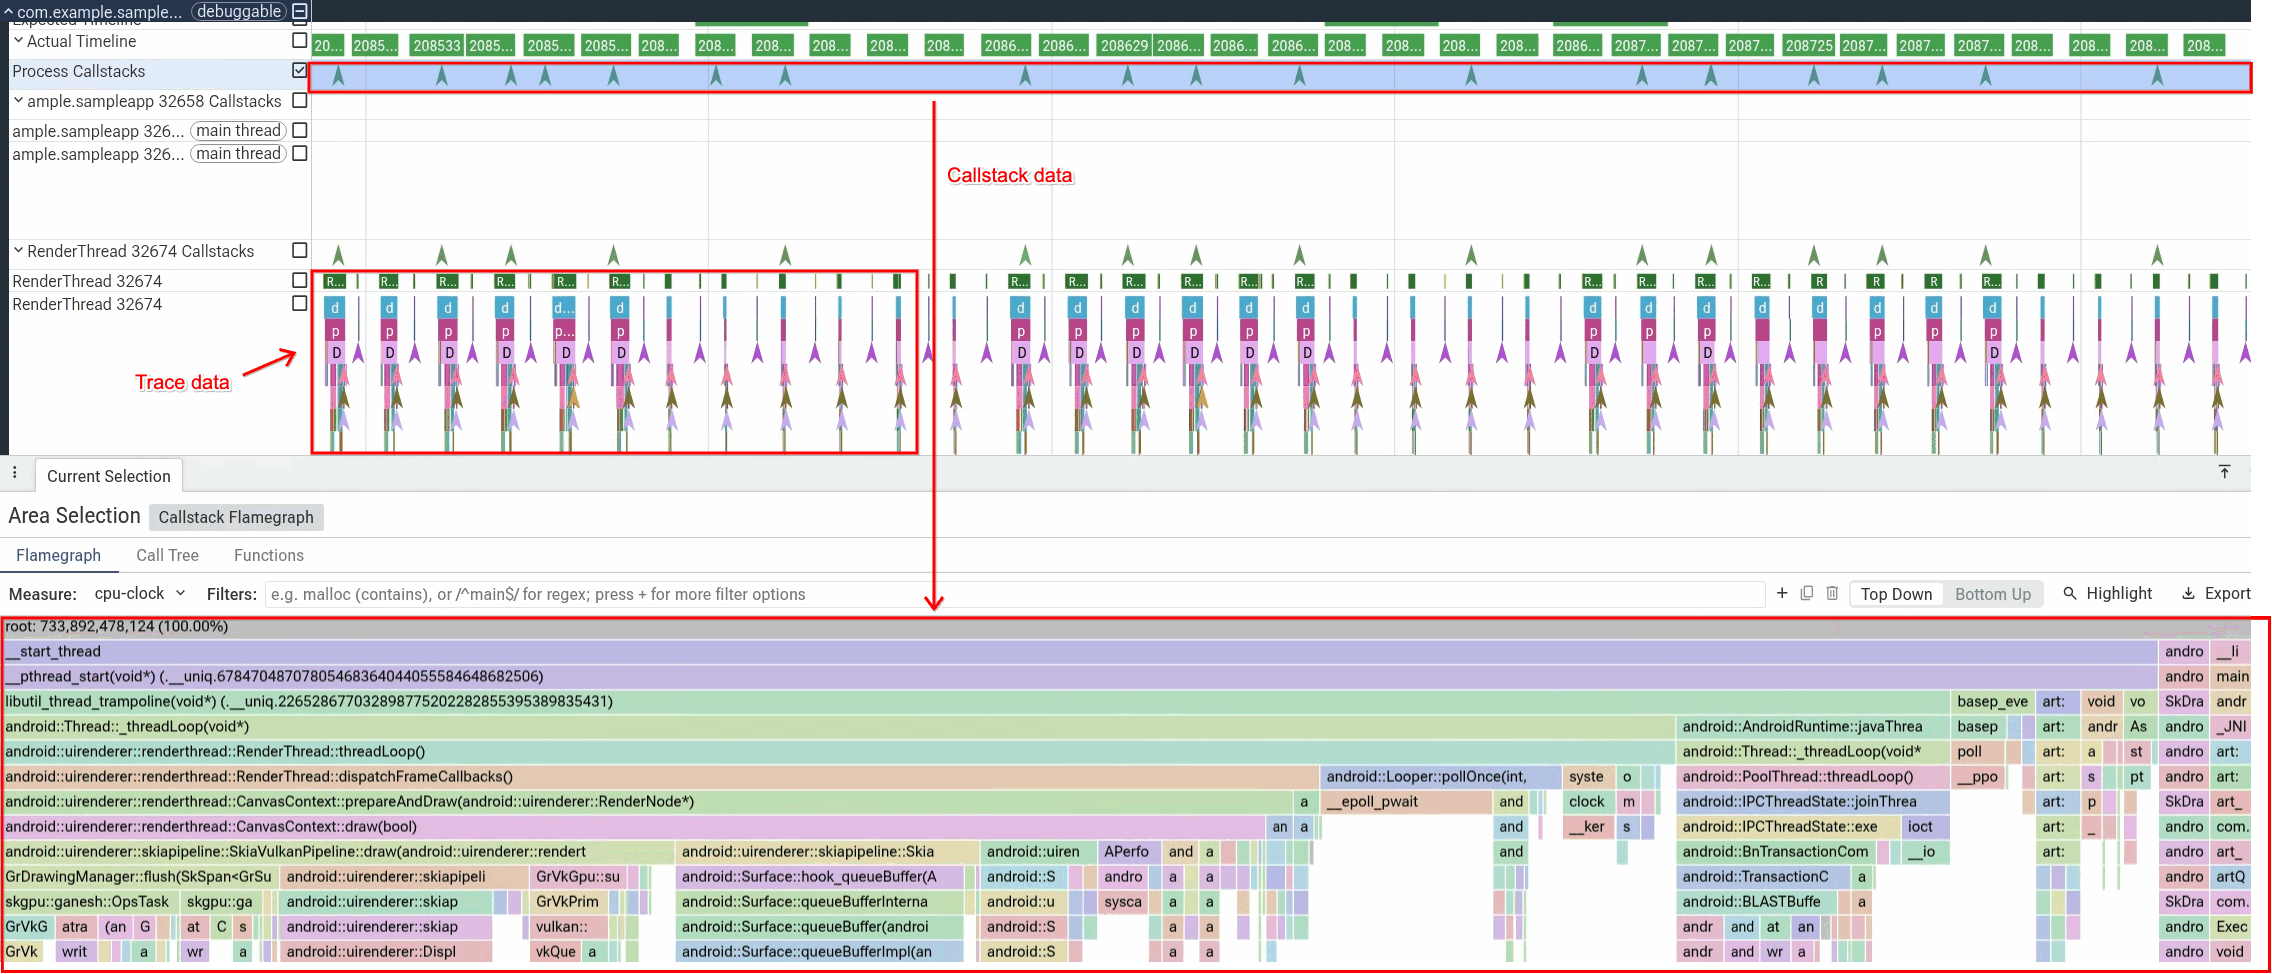
When you open the resulting profile in the Perfetto UI, the sampled call stacks appear as dedicated Callstacks tracks alongside your app's regular trace slices. Select a region of a call stack track to view a flame graph of the sampled call stacks for that time range, as shown in Figure 1.
Capture a Java heap dump
You can request a snapshot of your app's Java memory using
JavaHeapDumpRequestBuilder (or PROFILING_TYPE_JAVA_HEAP_DUMP).
Unlike standard .hprof heap dumps captured with Debug.dumpHprofData,
ProfilingManager heap dumps are designed for safe, low-overhead collection in
production:
- Non-freezing collection: The system forks a copy-on-write clone of your app's process and collects the heap snapshot from the cloned process, so your app doesn't freeze while the dump is written to disk.
- Reference graph only (no raw object data): Instead of dumping raw memory
contents like an
.hproffile,ProfilingManagerrecords a.perfetto-java-heap-dumpprotobuf graph containing classes, object sizes, reference chains, and garbage collection (GC) roots while omitting primitive values, string contents, and array payloads. This protects user privacy and reduces file size. For a full breakdown, see How ProfilingManager heap dumps differ from HPROF dumps.
Using the same Context, Executor, and resultCallback setup shown in
Record a system trace, build a request with
JavaHeapDumpRequestBuilder:
Kotlin
val heapDumpRequest = JavaHeapDumpRequestBuilder() .setTag("memory-leak-check") .build() requestProfiling( appContext, heapDumpRequest, callbackExecutor, resultCallback )
Java
ProfilingRequest heapDumpRequest = new JavaHeapDumpRequestBuilder() .setTag("memory-leak-check") .build(); Profiling.requestProfiling( getApplicationContext(), heapDumpRequest, callbackExecutor, resultCallback );
For a complete end-to-end walkthrough of analyzing a Java heap dump to diagnose a memory leak, see Case study: Debug an OOM crash.
Next steps
After capturing profiles, retrieve them locally with adb or upload them to
your backend with WorkManager.