

在 Android 15 (API 級別 35) 以上版本中,應用程式導向分析功能可讓應用程式使用 ProfilingManager API 或 AndroidX Core (androidx.core:core 1.15.0 以上版本) 建構工具,在程式碼中明確啟動和停止支援的設定檔記錄。如要控制剖析時間或工作階段參數 (例如持續時間、緩衝區政策和取樣率),或指定特定使用者歷程或執行階段條件,請使用直接剖析。
新增依附元件
為獲得 ProfilingManager API 的最佳體驗,請將下列 Jetpack 程式庫新增至 build.gradle.kts 檔案。
Kotlin
   dependencies {
       implementation("androidx.tracing:tracing-ktx:2.0.5")
       implementation("androidx.core:core:1.19.1")
   }
Groovy
   dependencies {
       implementation 'androidx.tracing:tracing-ktx:2.0.5'
       implementation 'androidx.core:core:1.19.1'
   }
錄製系統追蹤記錄
新增必要的依附元件後,請使用下列程式碼記錄系統追蹤記錄。這個範例說明如何啟動分析工作階段,同時安全地管理主執行緒以外的繁重作業。
Kotlin
@RequiresApi(Build.VERSION_CODES.VANILLA_ICE_CREAM) @Composable fun ProfiledScreen(modifier: Modifier = Modifier) { // Use the application context: requestProfiling resolves the ProfilingManager // system service from it, so there's no reason to hand it a short-lived Activity. val appContext = LocalContext.current.applicationContext val scope = rememberCoroutineScope() Button( onClick = { // Run the orchestration off the main thread. Profiling a heavy operation // on the UI thread would freeze the UI (ANR) and distort the very metrics // you're trying to capture. // // Note: this scope is tied to composition. If the user leaves this screen // mid-session, the coroutine is cancelled and stopSignal.cancel() might not // run, but setDurationMs() acts as a safety net and ends the profile. scope.launch(Dispatchers.Default) { val callbackExecutor = Dispatchers.IO.asExecutor() val resultCallback = Consumer<ProfilingResult> { profilingResult -> if (profilingResult.errorCode == ProfilingResult.ERROR_NONE) { Log.d("ProfileTest", "Result file: ${profilingResult.resultFilePath}") } else { // errorMessage explains the failure (e.g., rate limiting); keep it. Log.e( "ProfileTest", "Profiling failed errorCode=${profilingResult.errorCode} " + "errorMessage=${profilingResult.errorMessage}" ) } } val stopSignal = CancellationSignal() val requestBuilder = SystemTraceRequestBuilder().apply { setCancellationSignal(stopSignal) setTag("FOO") // Caller-supplied tag for identification. setDurationMs(60000) // Hard cap: ends the session if cancel() never fires. setBufferFillPolicy(BufferFillPolicy.RING_BUFFER) setBufferSizeKb(32768) } // 1. Start the session. This is asynchronous system IPC. The tracing // engine takes a moment to start and allocate buffers. requestProfiling(appContext, requestBuilder.build(), callbackExecutor, resultCallback) // 2. The API exposes no "profiling started" signal, so pad with a short, // best-effort delay before running the code you care about. This is // approximate. Increase it on slower or heavily loaded devices. delay(STARTUP_PADDING_MS) // 3. The session is already recording every thread in your app. This slice // doesn't scope what's captured. It just labels this region of the // timeline so heavyOperation() is easier to find. trace { } closes the // section even if the block throws. trace("MyApp:HeavyOperation") { heavyOperation() } // 4. Stop recording. Until this fires or the setDurationMs() cap is // reached (whichever comes first), the session keeps capturing app-wide // activity. stopSignal.cancel() } } ) { Text("Run & Profile Heavy Operation") } } // Best-effort wait for the system trace engine to initialize before profiling. // There is no deterministic start callback; tune this for your target devices. private const val STARTUP_PADDING_MS = 100L fun heavyOperation() { // Background computations to profile. }
Java
void sampleRecordSystemTrace(Context context) { // Use the application context: requestProfiling resolves the ProfilingManager // system service from it, so there's no reason to hand it a short-lived Activity. Context appContext = context.getApplicationContext(); // Run the orchestration off the main thread. Profiling a heavy operation // on the UI thread would freeze the UI (ANR) and distort the very metrics // you're trying to capture. profilingExecutor.execute(() -> { Executor callbackExecutor = Executors.newSingleThreadExecutor(); Consumer<ProfilingResult> resultCallback = profilingResult -> { if (profilingResult.getErrorCode() == ProfilingResult.ERROR_NONE) { Log.d("ProfileTest", "Result file: " + profilingResult.getResultFilePath()); } else { // errorMessage explains the failure (e.g., rate limiting); keep it. Log.e( "ProfileTest", "Profiling failed errorCode=" + profilingResult.getErrorCode() + " errorMessage=" + profilingResult.getErrorMessage()); } }; CancellationSignal stopSignal = new CancellationSignal(); SystemTraceRequestBuilder requestBuilder = new SystemTraceRequestBuilder(); requestBuilder.setCancellationSignal(stopSignal); requestBuilder.setTag("FOO"); // Caller-supplied tag for identification. requestBuilder.setDurationMs(60000); // Hard cap: ends the session if cancel() never fires. requestBuilder.setBufferFillPolicy(BufferFillPolicy.RING_BUFFER); requestBuilder.setBufferSizeKb(32768); // 1. Start the session. This is asynchronous system IPC. The tracing // engine takes a moment to start and allocate buffers. Profiling.requestProfiling( appContext, requestBuilder.build(), callbackExecutor, resultCallback); // 2. The API exposes no "profiling started" signal, so pad with a short, // best-effort delay before running the code you care about. This is // approximate. Increase it on slower or heavily loaded devices. try { Thread.sleep(STARTUP_PADDING_MS); } catch (InterruptedException e) { Thread.currentThread().interrupt(); stopSignal.cancel(); return; } // 3. The session is already recording every thread in your app. This slice // doesn't scope what's captured. It just labels this region of the // timeline so heavyOperation() is easier to find. try/finally closes the // section even if heavyOperation() throws. Trace.beginSection("MyApp:HeavyOperation"); try { heavyOperation(); } finally { Trace.endSection(); } // 4. Stop recording. Until this fires or the setDurationMs() cap is // reached (whichever comes first), the session keeps capturing app-wide // activity. stopSignal.cancel(); }); } // Best-effort wait for the system trace engine to initialize before profiling. // There is no deterministic start callback; tune this for your target devices. private static final long STARTUP_PADDING_MS = 100L; // Single background thread that runs the profiling orchestration. private final ExecutorService profilingExecutor = Executors.newSingleThreadExecutor(); void heavyOperation() { // Background computations to profile. }
程式碼範例會透過下列步驟設定及管理分析工作階段:
- 設定執行器:建立非 UI
Executor,接收主執行緒以外的分析結果。 - 處理剖析結果:建立
Consumer<ProfilingResult>回呼,接收ProfilingManager的完成結果或錯誤。 建構剖析要求:建立
SystemTraceRequestBuilder,自訂工作階段設定 (或省略自訂設定,使用系統預設值):setTag():附加呼叫端提供的標記,由ProfilingResult.getTag傳回,並附加至輸出檔案名稱 (最多前 20 個小寫英數字元和連字號)。setDurationMs():設定錄製時間長度上限,以毫秒為單位 (例如60000代表 60 秒)。setBufferFillPolicy():定義緩衝區如何處理容量限制:BufferFillPolicy.RING_BUFFER會在緩衝區滿時覆寫最舊的資料,而BufferFillPolicy.DISCARD則會在緩衝區滿時停止記錄新資料。setBufferSizeKb():設定錄製緩衝區空間 (以 KB 為單位)。
選用:提早停止錄製:傳遞
CancellationSignal(stopSignal),在目標作業完成後立即停止工作階段,儲存目前記錄的資料,並將ProfilingResult傳送至回呼。詳情請參閱「停止錄製」。啟動並接收結果:呼叫
requestProfiling(),在背景開始錄音。工作階段結束時,resultCallback.accept()會收到ProfilingResult:- 成功時 (
ERROR_NONE),呼叫getResultFilePath()取得裝置端路徑。如需使用adb提取檔案或使用WorkManager上傳檔案的操作說明,請參閱「擷取及上傳設定檔」。 - 如果失敗,請檢查
getErrorCode()和getErrorMessage()。要求可能會因頻率限制和其他原因而失敗。 - 如果應用程式在結果傳送前終止,系統會將結果排入佇列,並在應用程式下次使用
registerForAllProfilingResults註冊全域事件監聽器時傳送結果。
- 成功時 (
新增自訂追蹤點:將作業包裝在
trace("...") { ... }(或Trace.beginSection()/Trace.endSection()) 中,為時間軸的區域加上標籤。
停止進行中的錄製
如要在互動完成後立即停止擷取,而不是等待 setDurationMs() 到期,請將 CancellationSignal 傳遞至 setCancellationSignal() 或 requestProfiling()。如果同時指定 CancellationSignal 和 setDurationMs(),則以先發生者為準結束工作階段;如果兩者皆未指定,系統會套用預設時間長度。
呼叫 cancel() 不會捨棄錄製內容。系統會停止擷取、遮蓋並儲存目前收集到的資料,然後透過 ERROR_NONE 將 ProfilingResult 傳送至事件監聽器。
使用呼叫堆疊取樣功能記錄系統追蹤記錄
在搭載 Android 17 (API 級別 37) 以上版本 (或搭載更新版 Profiling 主線模組的 Android 16) 的裝置上,ProfilingManager 支援在單一工作階段中,同時收集取樣呼叫堆疊和系統追蹤記錄,以便您查看時間軸事件 (例如執行緒狀態、影格和自訂追蹤記錄切片),以及未明確追蹤檢測的方法的 CPU 呼叫堆疊。
這個範例也說明如何直接呼叫 ProfilingManager.requestProfiling,而不使用 Jetpack 建構工具,方法是指定其中一種支援的設定檔類型 (PROFILING_TYPE_SYSTEM_TRACE),並傳遞設定 Bundle:
Kotlin
val profilingManager = context.getSystemService(ProfilingManager::class.java) // Pass a Bundle to customize the capture, or pass null for default settings. val config = Bundle().apply { putInt("KEY_DURATION_MS", 15000) // 15 seconds putInt("KEY_SIZE_KB", 20480) // 20 MB buffer size // Collect sampled CPU call stacks alongside the system trace. putBoolean("KEY_COLLECT_STACK_SAMPLING", true) putInt("KEY_FREQUENCY_HZ", 100) // Sampling frequency in Hz // Optional: Set KEY_SAMPLE_BINDER_ONLY to true to sample only binder calls. } profilingManager?.requestProfiling( ProfilingManager.PROFILING_TYPE_SYSTEM_TRACE, config, "trace-with-callstacks", null, callbackExecutor, resultCallback )
Java
ProfilingManager profilingManager = context.getSystemService(ProfilingManager.class); if (profilingManager == null) return; // Pass a Bundle to customize the capture, or pass null for default settings. Bundle config = new Bundle(); config.putInt("KEY_DURATION_MS", 15000); // 15 seconds config.putInt("KEY_SIZE_KB", 20480); // 20 MB buffer size // Collect sampled CPU call stacks alongside the system trace. config.putBoolean("KEY_COLLECT_STACK_SAMPLING", true); config.putInt("KEY_FREQUENCY_HZ", 100); // Sampling frequency in Hz // Optional: Set KEY_SAMPLE_BINDER_ONLY to true to sample only binder calls. profilingManager.requestProfiling( ProfilingManager.PROFILING_TYPE_SYSTEM_TRACE, config, "trace-with-callstacks", null, callbackExecutor, resultCallback );
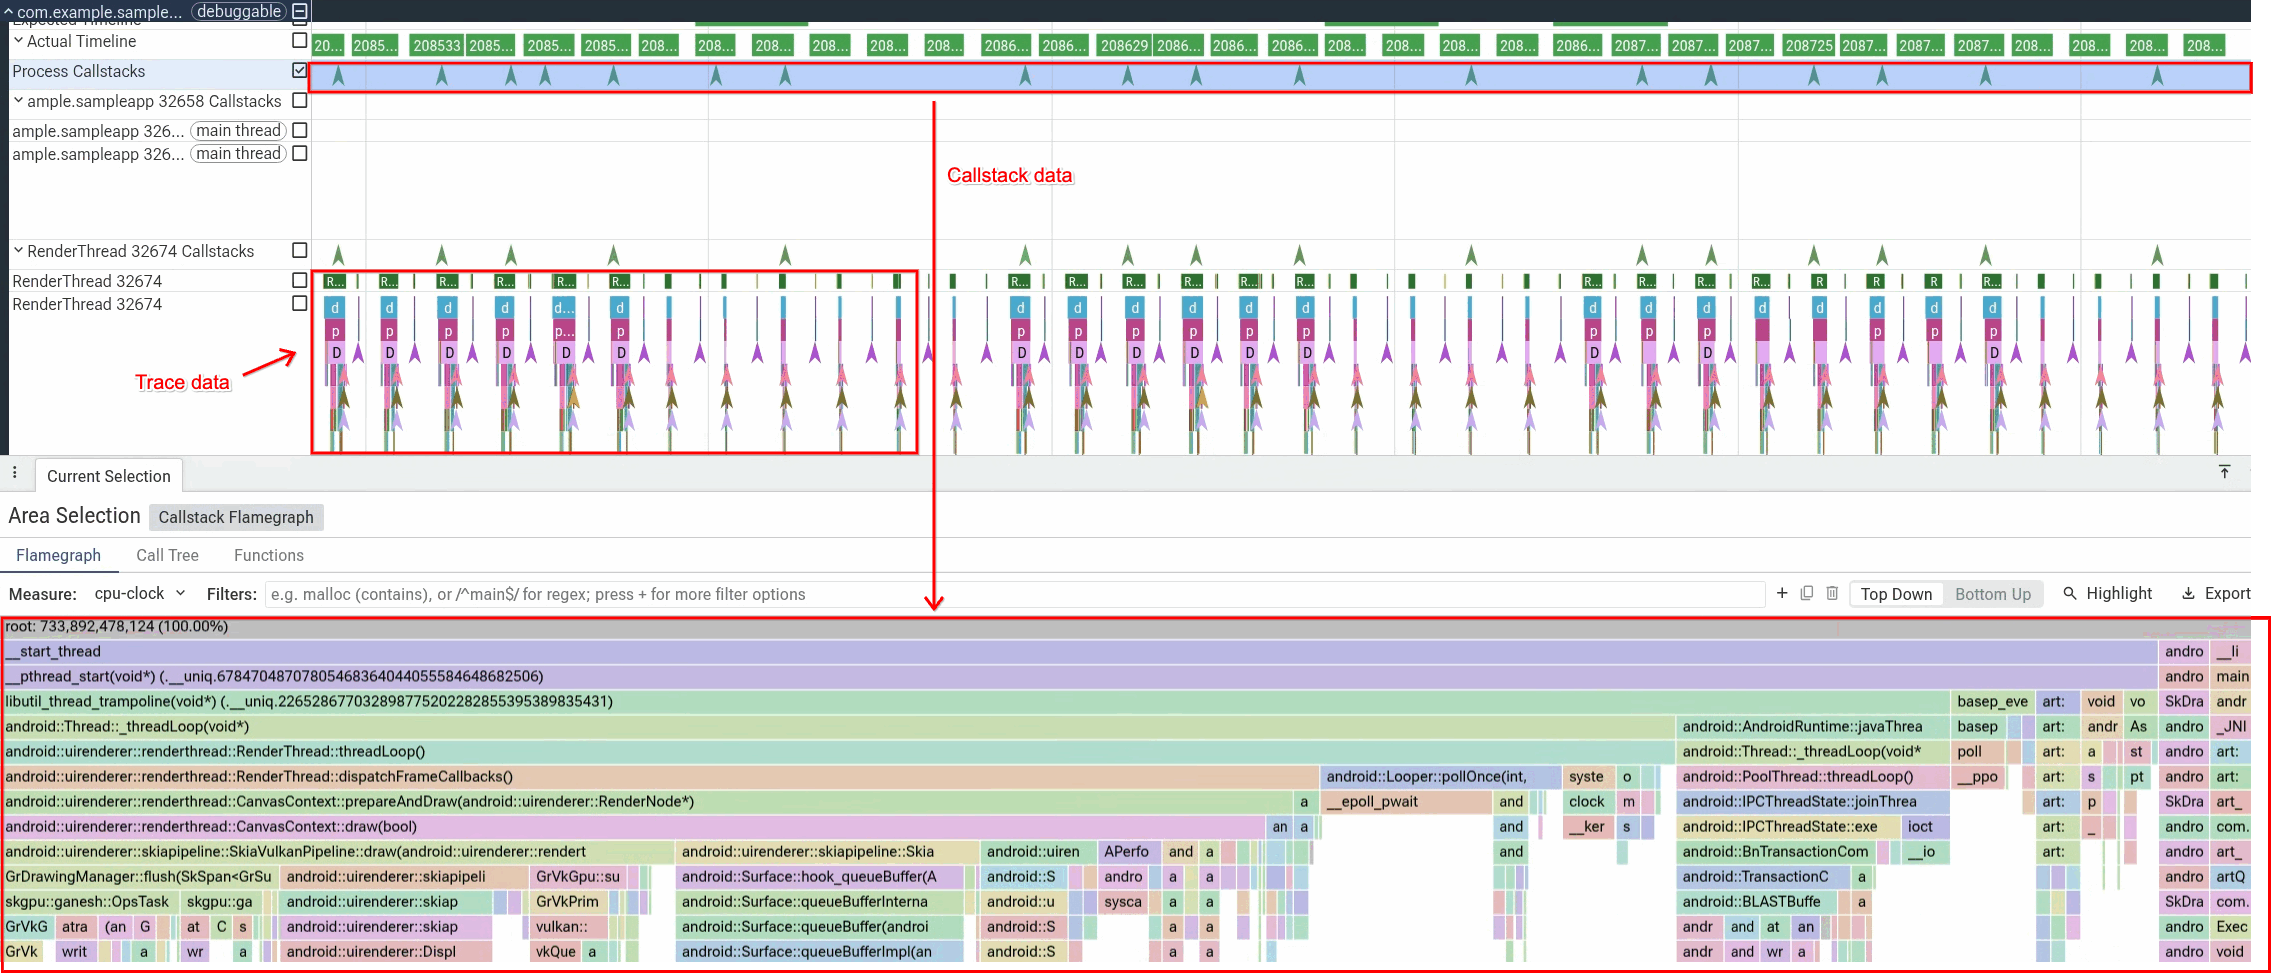
在 Perfetto UI 中開啟產生的設定檔時,取樣的呼叫堆疊會顯示為專屬的「Callstacks」軌跡,以及應用程式的一般追蹤記錄片段。選取呼叫堆疊軌跡的某個區域,即可查看該時間範圍內取樣呼叫堆疊的火焰圖,如圖 1 所示。
擷取 Java 記憶體快照資料
您可以使用 JavaHeapDumpRequestBuilder (或 PROFILING_TYPE_JAVA_HEAP_DUMP) 要求應用程式 Java 記憶體的快照。與使用 Debug.dumpHprofData 擷取的標準 .hprof 記憶體快照資料不同,ProfilingManager 記憶體快照資料是專為在實際工作環境中安全、低負擔的收集作業而設計:
- 非凍結收集:系統會分支應用程式程序的寫入時複製副本,並從複製的程序收集堆積快照,因此在將轉儲寫入磁碟時,應用程式不會凍結。
- 僅限參照圖 (無原始物件資料):
ProfilingManager不會像.hprof檔案一樣傾印原始記憶體內容,而是記錄.perfetto-java-heap-dumpprotobuf 圖,其中包含類別、物件大小、參照鏈和垃圾收集 (GC) 根,同時省略原始值、字串內容和陣列酬載。這樣做可以保護使用者隱私,並縮減檔案大小。如需完整細目,請參閱「ProfilingManager 記憶體快照資料與 HPROF 記憶體快照資料有何不同」。
使用「記錄系統追蹤」中所示的相同 Context、Executor 和 resultCallback 設定,透過 JavaHeapDumpRequestBuilder 建構要求:
Kotlin
val heapDumpRequest = JavaHeapDumpRequestBuilder() .setTag("memory-leak-check") .build() requestProfiling( appContext, heapDumpRequest, callbackExecutor, resultCallback )
Java
ProfilingRequest heapDumpRequest = new JavaHeapDumpRequestBuilder() .setTag("memory-leak-check") .build(); Profiling.requestProfiling( getApplicationContext(), heapDumpRequest, callbackExecutor, resultCallback );
如需分析 Java 記憶體快照資料以診斷記憶體流失的完整端對端逐步操作說明,請參閱「個案研究:對 OOM 當機問題進行偵錯」。
後續步驟
擷取設定檔後,請使用 adb 在本機擷取設定檔,或使用 WorkManager 將設定檔上傳至後端。