
After you retrieve a profile from a test device or download it from your
backend, you can open the file in the Perfetto UI to inspect timelines,
thread states, and memory retention graphs. This page describes how to navigate
redacted system traces and Java heap dumps captured with ProfilingManager.
Visualize system traces
Open your .perfetto-trace file in the Perfetto UI to inspect CPU and
thread activity over time.

To protect user privacy, ProfilingManager redacts system traces by combining
CPU activity from all other processes into a single OtherProcesses track.
Inspecting this combined track still lets you determine whether slowness in your
app was caused by an internal bottleneck or overall device load.
Figure 2 highlights the main sections of a redacted system trace:

- CPU list: Displays all available processors on your device.
- CPU tasks: Shows which threads each CPU was executing.
- Other processes view: Displays CPU resources consumed by other processes.
- Process View: Shows your app's process.
- Threads View: Displays threads running within your process and their thread states (Runnable (R), Running (R), Sleeping (S), Uninterruptible Sleep (D)), which map directly to Linux Process States.
- Trace slices: This section shows trace annotations added by app
developers or the framework. These annotations encompass computations
between
Trace.beginSectionandTrace.endSection.
For more information on Perfetto UI and trace visualization, see the Perfetto docs.
Visualize Java heap dumps
Once you capture a Java heap dump using PROFILING_TYPE_JAVA_HEAP_DUMP,
open the resulting .perfetto-java-heap-dump file in the Perfetto UI to
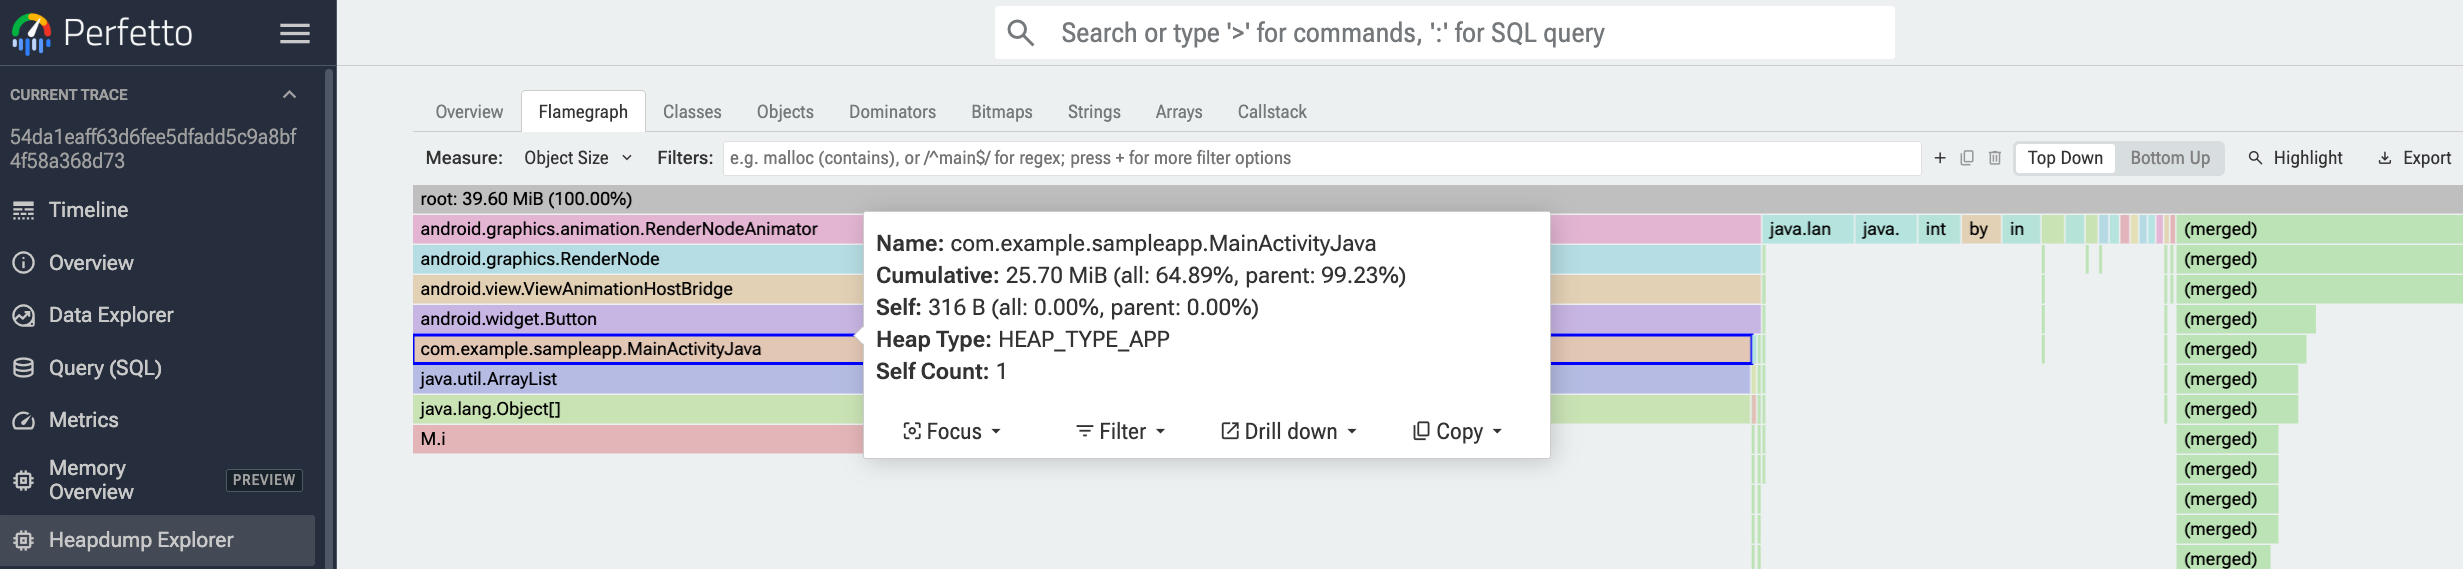
identify memory leaks or optimize memory usage. In the Heapdump Explorer,
you can explore the heap graph, inspect flame graphs of cumulative object sizes,
and browse classes, objects, and dominators, as shown in Figure 3.
How ProfilingManager heap dumps differ from HPROF dumps
Unlike standard .hprof heap dumps (such as those captured with
Debug.dumpHprofData or in Android Studio), ProfilingManager captures a
Perfetto ART heap dump (.perfetto-java-heap-dump). Rather than dumping
raw memory contents, ProfilingManager records the object retention graph and
sizing metadata while omitting the raw data stored inside objects:
- What's collected:
- Classes and types: Class names, superclass hierarchies, classloaders, instance sizes, and reference types (such as normal classes, arrays, strings, or weak, soft, finalizer, and phantom references).
- Object instances and sizes: Each object's shallow size
(
self_size), its heap region (HEAP_TYPE_APP,HEAP_TYPE_ZYGOTE, orHEAP_TYPE_BOOT_IMAGE), and associated native memory registered throughNativeAllocationRegistry. - References and GC roots: Garbage collection roots (such as JNI globals and locals, Java stack frames, and thread objects) and field-level reference chains showing which object retains another object and through which field name.
- Select sizing metadata: Non-sensitive metadata for specific
framework types, such as
Bitmapdimensions (mWidthandmHeight).
- What's omitted: Actual primitive field values,
Stringcharacter contents, and raw array payloads (byte[],char[], and other primitive arrays). Omitting raw object contents protects user privacy on production devices and keeps dump files significantly smaller.
Next steps
Beyond visual inspection in the Perfetto UI, you can query profiles with PerfettoSQL, analyze traces in bulk, or analyze profiles with AI.