

当应用耗尽其分配的 Java 堆且无法满足新的内存分配需求时,就会发生内存不足 (OutOfMemoryError) 崩溃。OutOfMemoryError 崩溃报告中的堆栈轨迹很少能揭示根本原因,因为它们仅显示内存耗尽时失败的分配调用,而不会显示保留堆其余部分的对象。
ProfilingManager 可让您从现场和本地设备中捕获 Java 堆转储,以便您在 Perfetto 界面中检查对象保留图,并精准锁定占用内存的根源。
场景
假设您的崩溃报告工具标记了在生产环境中用户与 OomSampleActivity 互动时发生的 OutOfMemoryError 崩溃数量不断增加。
为了进行调查,您需要向 ProfilingManager 注册 TRIGGER_TYPE_OOM 触发器,以便系统在发生 OutOfMemoryError 时自动捕获 Java 堆转储。
捕获堆转储
在 Android 17(API 级别 37)及更高版本中,如需在发生 OutOfMemoryError 崩溃时捕获堆转储,请使用 ProfilingTrigger.TRIGGER_TYPE_OOM 配置基于触发器的性能分析。当应用抛出未处理的 OutOfMemoryError 时,系统会自动启动新的 PROFILING_TYPE_JAVA_HEAP_DUMP 捕获。
由于应用进程会在发生崩溃时终止,因此系统会在后台完成堆转储保存,并将结果排入队列(请参阅触发器生命周期)。在应用启动完成后,使用 registerForAllProfilingResults 在后台 Executor 上注册全局结果监听器(这样就不会减慢应用启动速度),以便您的应用在用户下次启动时收到已加入队列的 ProfilingResult。与 addProfilingTriggers(在应用重启后仍会保留,只需调用一次或在更新触发器时调用)不同,registerForAllProfilingResults 必须在每次应用启动时调用:
Kotlin
@RequiresApi(Build.VERSION_CODES.CINNAMON_BUN) fun registerOomTrigger(context: Context) { val profilingManager = context.getSystemService(ProfilingManager::class.java) ?: return val callbackExecutor: Executor = Executors.newSingleThreadExecutor() val resultCallback = Consumer<ProfilingResult> { profilingResult -> if ( profilingResult.errorCode == ProfilingResult.ERROR_NONE && profilingResult.triggerType == ProfilingTrigger.TRIGGER_TYPE_OOM ) { val heapDumpPath = profilingResult.resultFilePath // Schedule a background job to compress and upload heapDumpPath } } profilingManager.registerForAllProfilingResults(callbackExecutor, resultCallback) val oomTrigger = ProfilingTrigger.Builder(ProfilingTrigger.TRIGGER_TYPE_OOM) .build() profilingManager.addProfilingTriggers(listOf(oomTrigger)) }
Java
@RequiresApi(Build.VERSION_CODES.CINNAMON_BUN) public static void registerOomTrigger(Context context) { ProfilingManager profilingManager = context.getSystemService(ProfilingManager.class); if (profilingManager == null) return; Executor callbackExecutor = Executors.newSingleThreadExecutor(); Consumer<ProfilingResult> resultCallback = profilingResult -> { if (profilingResult.getErrorCode() == ProfilingResult.ERROR_NONE && profilingResult.getTriggerType() == ProfilingTrigger.TRIGGER_TYPE_OOM) { String heapDumpPath = profilingResult.getResultFilePath(); // Schedule a background job to compress and upload heapDumpPath } }; profilingManager.registerForAllProfilingResults(callbackExecutor, resultCallback); ProfilingTrigger oomTrigger = new ProfilingTrigger.Builder(ProfilingTrigger.TRIGGER_TYPE_OOM) .build(); profilingManager.addProfilingTriggers(Collections.singletonList(oomTrigger)); }
对配置文件进行去混淆处理
在 OutOfMemoryError 触发捕获并且您的回调在下次应用启动时收到 ProfilingResult 后,请将配置文件上传到您的服务器,或使用 adb 将其拉取到您的开发机器。如果您从使用 R8 代码缩减和混淆的发布 build 中捕获了配置文件,请先在工作站或服务器上离线对其进行去混淆处理,然后再进行分析。如果不进行去混淆处理,R8 会混淆原始堆转储中的 Java 和 Kotlin 类、字段和方法名称(例如,将原始类名称转换为 a.b)。
将 Perfetto 的 trace_processor bundle 命令与 --proguard-map 标志结合使用,将捕获的配置文件与为该确切发布 build 生成的 R8 mapping.txt 文件打包在一起:
trace_processor bundle \
  --proguard-map /path/to/mapping.txt \
  profile_trigger-type-7_2026-05-06-14-12-40-748_uid-10316.perfetto-java-heap-dump \
  deobfuscated_oom.tar
此命令会生成 deobfuscated_oom.tar,这是一个经过扩充的归档文件,其中包含原始配置文件及其去混淆映射。当您在 Perfetto 界面中打开此归档文件或使用 trace_processor 查询该文件时,Perfetto 会自动恢复所有原始类、字段和方法名称。如需了解详情,请参阅 Perfetto 符号化和去混淆文档。
分析堆转储
您可以按照以下步骤在 Perfetto 界面中手动检查去混淆的堆转储,也可以使用 AI 智能体自动进行 OOM 调查。
在 Perfetto 界面中打开去混淆的堆转储,然后在左侧导航栏中选择 Heapdump Explorer。在火焰图标签页中,将测量设置为对象大小,图 1 中的保留层次结构会立即突出显示。
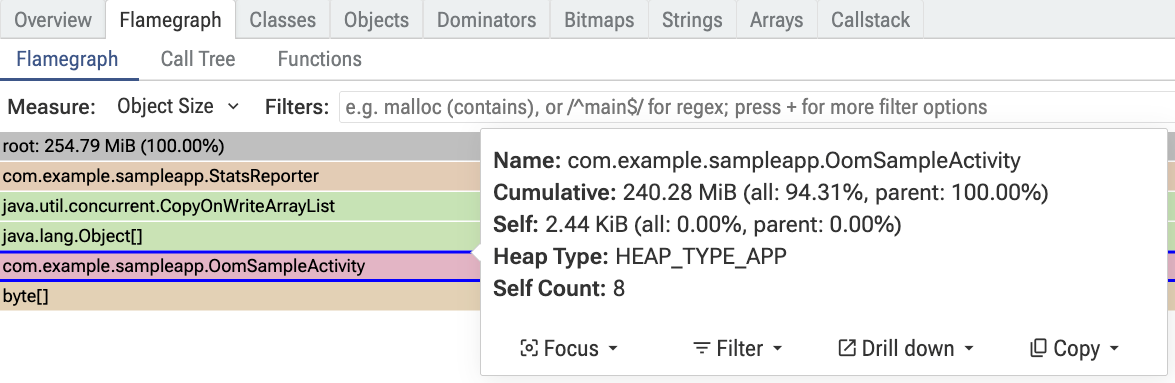
OomSampleActivity 实例。检查图 1 中的火焰图,可以发现几个关键结果:
- 大量内存保留:在 254.79 MiB 的总堆 (
root) 中,com.example.sampleapp.OomSampleActivity保留了 240.28 MiB(整个应用堆的 94.31%)的累积大小,其中大部分位于子byte[]数组中。 - 多个实时活动实例:选择
OomSampleActivity帧会显示自身计数:8。尽管在任何给定时间屏幕上应该只有一个OomSampleActivity实例,但内存中同时存在 8 个单独的实例。 - 保留对象路径:在火焰图中读取
OomSampleActivity的父级帧,会显示使这些实例保持活跃状态的引用链:com.example.sampleapp.StatsReporter包含java.util.concurrent.CopyOnWriteArrayList(由java.lang.Object[]提供支持),后者直接引用所有 8 个OomSampleActivity实例。
找出代码中的根本原因
由于保留路径从 StatsReporter 指向 OomSampleActivity,因此请检查代码库中的这两个类。
StatsReporter 是一个单例,用于维护 StatsListener 回调列表,并定期从后台轮询线程发布更新:
Kotlin
class StatsReporter private constructor() { fun interface StatsListener { fun onReportStats(stats: String) } private val listeners: MutableList<StatsListener> = CopyOnWriteArrayList() private var isReporting = false init { startReporting() } fun registerListener(listener: StatsListener) { if (!listeners.contains(listener)) { listeners.add(listener) } } fun unregisterListener(listener: StatsListener) { listeners.remove(listener) } private fun startReporting() { if (isReporting) return isReporting = true Thread({ while (true) { try { // Poll every 10 seconds Thread.sleep(10000) } catch (e: InterruptedException) { Thread.currentThread().interrupt() break } for (listener in listeners) { // Send periodic mock stats update from the background thread listener.onReportStats("Update from StatsReporter background polling thread") } } }, "StatsReporterPollingThread").start() } companion object { private var instance: StatsReporter? = null @JvmStatic fun getInstance(): StatsReporter { return instance ?: StatsReporter().also { instance = it } } } }
Java
public class StatsReporter { public interface StatsListener { void onReportStats(String stats); } private static StatsReporter sInstance; private final List<StatsListener> mListeners = new CopyOnWriteArrayList<>(); private boolean mIsReporting = false; private StatsReporter() { startReporting(); } public static StatsReporter getInstance() { if (sInstance == null) { sInstance = new StatsReporter(); } return sInstance; } public void registerListener(StatsListener listener) { if (!mListeners.contains(listener)) { mListeners.add(listener); } } public void unregisterListener(StatsListener listener) { mListeners.remove(listener); } private void startReporting() { if (mIsReporting) return; mIsReporting = true; new Thread(() -> { while (true) { try { // Poll every 10 seconds Thread.sleep(10000); } catch (InterruptedException e) { Thread.currentThread().interrupt(); break; } for (StatsListener listener : mListeners) { // Send periodic mock stats update from the background thread listener.onReportStats("Update from StatsReporter background polling thread"); } } }, "StatsReporterPollingThread").start(); } }
接下来,检查 OomSampleActivity:
Kotlin
class OomSampleActivity : Activity(), StatsReporter.StatsListener { // Allocate some memory. private val heavyData = ByteArray(30 * 1024 * 1024) override fun onCreate(savedInstanceState: Bundle?) { super.onCreate(savedInstanceState) setContentView(R.layout.activity_oom_sample) StatsReporter.getInstance().registerListener(this) } override fun onReportStats(stats: String) { // Read from heavyData so R8 doesn't strip it out as dead code during release builds Log.d(TAG, "Received stats in heavy leaked activity: $stats | Data size: ${heavyData.size}") } companion object { private const val TAG = "OomSampleActivity" } }
Java
public class OomSampleActivity extends Activity implements StatsReporter.StatsListener { private static final String TAG = "OomSampleActivity"; // Allocate some memory. private final byte[] mHeavyData = new byte[30 * 1024 * 1024]; @Override protected void onCreate(Bundle savedInstanceState) { super.onCreate(savedInstanceState); setContentView(R.layout.activity_oom_sample); StatsReporter.getInstance().registerListener(this); } @Override public void onReportStats(String stats) { // Read from mHeavyData so R8 does not strip it out as dead code during release builds Log.d(TAG, "Received stats in heavy leaked activity: " + stats + " | Data size: " + mHeavyData.length); } }
代码确认了 StatsReporter 保留 8 个 OomSampleActivity 实例的原因:
- 每个
OomSampleActivity实例都会分配一个 30 MiB 的byte[]缓冲区(在 Kotlin 中为heavyData,在 Java 中为mHeavyData),并将其自身注册为onCreate中单例StatsReporter的监听器。 - 当系统销毁
OomSampleActivity时,它绝不会调用unregisterListener。由于StatsReporter的生命周期比 activity 长,并且会保留对每个已注册监听器的强引用,因此垃圾回收器无法回收已销毁的实例或其 30 MiBbyte[]数组。 - 每次系统销毁并重新创建
OomSampleActivity时(例如在 Android activity 生命周期中旋转屏幕期间),StatsReporter中都会泄露另一个 30 MiB 实例。旋转 7 次后(8 个实例 × 30 MiB ≈ 240 MiB),堆已满,应用因OutOfMemoryError而崩溃。
修复泄露问题
如需修复内存泄漏问题,请在 activity 中替换 onDestroy 并调用 StatsReporter.getInstance().unregisterListener(this),以便在系统销毁 activity 时单例释放其引用:
Kotlin
class OomSampleActivityFixed : Activity(), StatsReporter.StatsListener { // Allocate some memory. private val heavyData = ByteArray(30 * 1024 * 1024) override fun onCreate(savedInstanceState: Bundle?) { super.onCreate(savedInstanceState) setContentView(R.layout.activity_oom_sample) // Register the activity as a listener StatsReporter.getInstance().registerListener(this) } override fun onDestroy() { super.onDestroy() // FIX: Unregister the listener to prevent the memory leak // when the Activity is destroyed (for example, during screen rotation). StatsReporter.getInstance().unregisterListener(this) } override fun onReportStats(stats: String) { // Read from heavyData so R8 doesn't strip it out as dead code during release builds Log.d(TAG, "Received stats in fixed heavy activity: $stats | Data size: ${heavyData.size}") } companion object { private const val TAG = "OomSampleFixed" } }
Java
public class OomSampleActivityFixed extends Activity implements StatsReporter.StatsListener { private static final String TAG = "OomSampleFixed"; // Allocate some memory. private final byte[] mHeavyData = new byte[30 * 1024 * 1024]; @Override protected void onCreate(Bundle savedInstanceState) { super.onCreate(savedInstanceState); setContentView(R.layout.activity_oom_sample); // Register the activity as a listener StatsReporter.getInstance().registerListener(this); } @Override protected void onDestroy() { super.onDestroy(); // FIX: Properly unregister the listener to prevent the memory leak // when the Activity is destroyed (e.g., during screen rotation). StatsReporter.getInstance().unregisterListener(this); } @Override public void onReportStats(String stats) { // Read from mHeavyData so R8 does not strip it out as dead code during release builds Log.d(TAG, "Received stats in fixed heavy activity: " + stats + " | Data size: " + mHeavyData.length); } }
使用 AI 智能体自动执行 OOM 调查
您可以使用配置了 Perfetto AI 技能的 AI 编码智能体来分析堆转储并将其与代码库相关联,而无需手动检查火焰图和跟踪跨文件的引用:
Analyze the Perfetto OOM heap dump at </path/to/profile>, which corresponds to
the codebase located at </path/to/codebase> using the Perfetto AI skill and find
the root cause of the OutOfMemoryError.
智能体使用 trace_processor 查询堆转储,跟踪从 StatsReporter 到泄漏的 OomSampleActivity 实例的支配路径,并检查代码库中的这两个类。在没有人工干预的情况下,它得出了相同的结论,即 OomSampleActivity 在 onCreate 中注册了监听器,但未将其取消注册,并生成了一个在 onDestroy 中添加 unregisterListener(this) 的补丁(以下报告是根据单独的捕获生成的,在崩溃时有 7 个保留的实例):
# Perfetto OOM Heap Dump Analysis Report

## 1. Orienting Context & First-Pass Triage

| Property | Value |
| :--- | :--- |
| **Process Name** | `com.example.sampleapp` |
| **Sample Timestamp (`graph_sample_ts`)** | `3433221241585` |
| **Leaf Retained Class** | `byte[]` (7 instances) |
| **Leaf Self Size** | `220,201,044` bytes (~210 MiB) |

### Dominator Tree Retention Path

Querying the `android.memory.heap_graph.dominator_tree` standard library module identifies the following largest dominated class path from GC root to leaf allocation:

    [ROOT_JAVA_FRAME] com.example.sampleapp.StatsReporter [1]
      -> java.util.concurrent.CopyOnWriteArrayList [1]
      -> java.lang.Object[] [1]
      -> com.example.sampleapp.OomSampleActivity [7]
      -> byte[] [7] (220,201,044 bytes)
## 2. Root Cause Analysis

> **Important:** The `OutOfMemoryError` is caused by an **Activity listener leak**: `OomSampleActivity` (`app/src/main/java/com/example/sampleapp/OomSampleActivity.java#L8-L27`) registers itself as a listener on the long-lived `StatsReporter` (`app/src/main/java/com/example/sampleapp/StatsReporter.java#L6-L61`) singleton in `onCreate()`, but never unregisters itself in `onDestroy()`.

### Step-by-Step Retention Mechanism

1. **Per-Activity 30 MiB Allocation:**
   Each instance of `OomSampleActivity` (`OomSampleActivity.java#L11-L12`) allocates a 30 MiB byte array (`30 * 1024 * 1024 = 31,457,280` bytes):
   ```java
   // OomSampleActivity.java:12
   private final byte[] mHeavyData = new byte[30 * 1024 * 1024];
   ```

2. **Strong Reference Registration in `onCreate()`:**
   When created, `OomSampleActivity.onCreate()` (`OomSampleActivity.java#L15-L20`) registers `this` with `StatsReporter` (`StatsReporter.java#L29-L33`):
   ```java
   // OomSampleActivity.java:19
   StatsReporter.getInstance().registerListener(this);
   ```

3. **GC Root Pinning via Background Thread & Singleton:**
   `StatsReporter` (`StatsReporter.java#L11-L60`) is both a static singleton (`sInstance`) and the owner of an active background thread (`StatsReporterPollingThread`, which holds a `[ROOT_JAVA_FRAME]` GC root reference while sleeping/looping in `startReporting()`). It stores listeners in `mListeners` (`CopyOnWriteArrayList<StatsListener>`).

4. **Leak Accumulation Across Activity Recreations:**
   Because `OomSampleActivity` does not override `onDestroy()` to call `StatsReporter.unregisterListener(this)`, every destroyed instance of `OomSampleActivity` remains strongly reachable in `mListeners`. After 7 Activity creations (7 * 30 MiB = 220,200,960 bytes plus array headers = `220,201,044` bytes), the Java heap is exhausted.

---

## 3. Actionable Implementation Plan

### 1. Unregister the Listener in `OomSampleActivity.onDestroy()`

Update `OomSampleActivity.java` to unregister the listener when the `Activity` is destroyed (matching the fix in `OomSampleActivityFixed.java`):

```diff
--- a/app/src/main/java/com/example/sampleapp/OomSampleActivity.java
+++ b/app/src/main/java/com/example/sampleapp/OomSampleActivity.java
@@ -19,4 +19,10 @@
         StatsReporter.getInstance().registerListener(this);
     }

+    @Override
+    protected void onDestroy() {
+        super.onDestroy();
+        StatsReporter.getInstance().unregisterListener(this);
+    }
+
     @Override
```

### 2. Optional Architectural Hardening in `StatsReporter`

* **Lifecycle-Aware Registration:** Have `StatsReporter.registerListener()` accept a `LifecycleOwner` and attach a `DefaultLifecycleObserver` that automatically invokes `unregisterListener()` on `ON_DESTROY`.
* **Weak References:** Store `WeakReference<StatsListener>` entries in `StatsReporter` and evict cleared references during iteration so forgotten `unregisterListener()` calls cannot retain entire `Activity` hierarchies.
验证修复
在测试设备上或在生产环境中验证泄漏问题是否已解决。
如果问题可在本地重现
由于 TRIGGER_TYPE_OOM 仅在发生 OutOfMemoryError 时捕获堆转储,因此成功修复后,触发器不会触发。如需检查堆并确认泄漏已消失,请旋转屏幕,然后从命令行捕获按需 Java 堆转储:
- 停用速率限制器 (
rate_limiter.disabled true) 并保留临时结果 (delete_temporary_results.disabled true),以便系统将命令行捕获内容保留在/data/misc/perfetto-traces/profiling/中。 - 在测试设备上打开
OomSampleActivityFixed,旋转屏幕 8 次或更多次,以确认应用不再崩溃,并将其保持在前台。 使用
cmd
profiling_service request-profiling
shell 命令触发按需 Java 堆转储 (profiling_type1):adb shell cmd profiling_service request-profiling 1 com.example.sampleapp从
/data/misc/perfetto-traces/profiling/拉取保留的配置文件,并在 Perfetto 界面中打开。
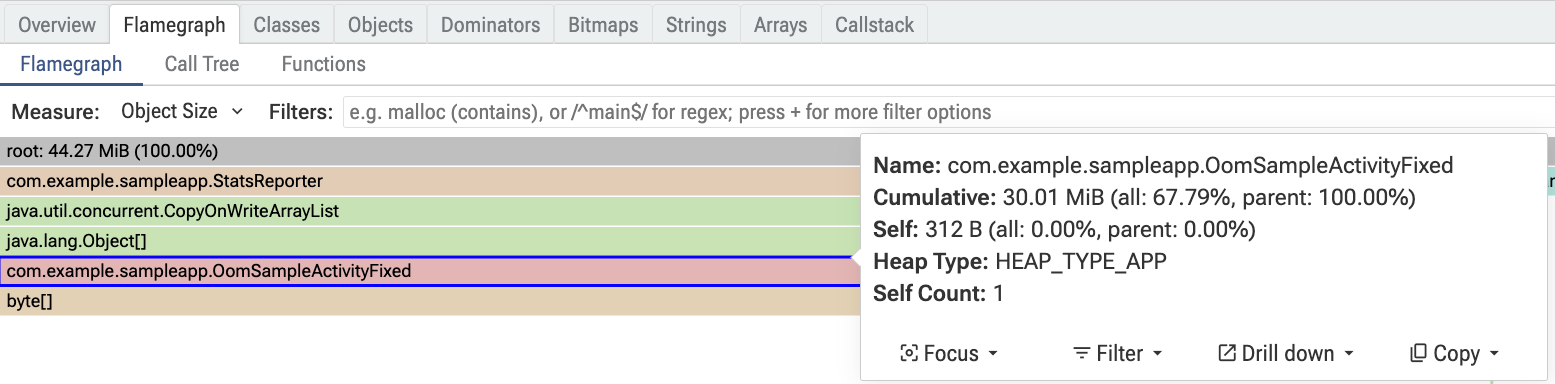
OomSampleActivityFixed 的单个实例。如图 2 所示,在多次屏幕旋转后:
com.example.sampleapp.OomSampleActivityFixed的自身计数为 1,而不是在每次旋转时累加一个实例。- 其累计保留大小保持在 30.01 MiB(总堆大小为 44.27 MiB),这证实了垃圾回收器会回收之前的 activity 实例。
如果问题难以在本地重现
如果复杂的跨屏导航、长时间会话或特定用户数据导致了 OutOfMemoryError,而您无法在测试设备上可靠地重现该问题,请在发布后在生产环境中验证修复效果:
- 在崩溃报告工具中监控
OutOfMemoryError崩溃集群,将其作为跨版本的代理指标,以确认涉及OomSampleActivity的崩溃是否有所减少。 - 检查从更新后的版本中收集的所有新
TRIGGER_TYPE_OOM堆转储,以验证StatsReporter不再保留已销毁的OomSampleActivity实例。