קל לארגן דפים בעזרת אוספים
אפשר לשמור ולסווג תוכן על סמך ההעדפות שלך.
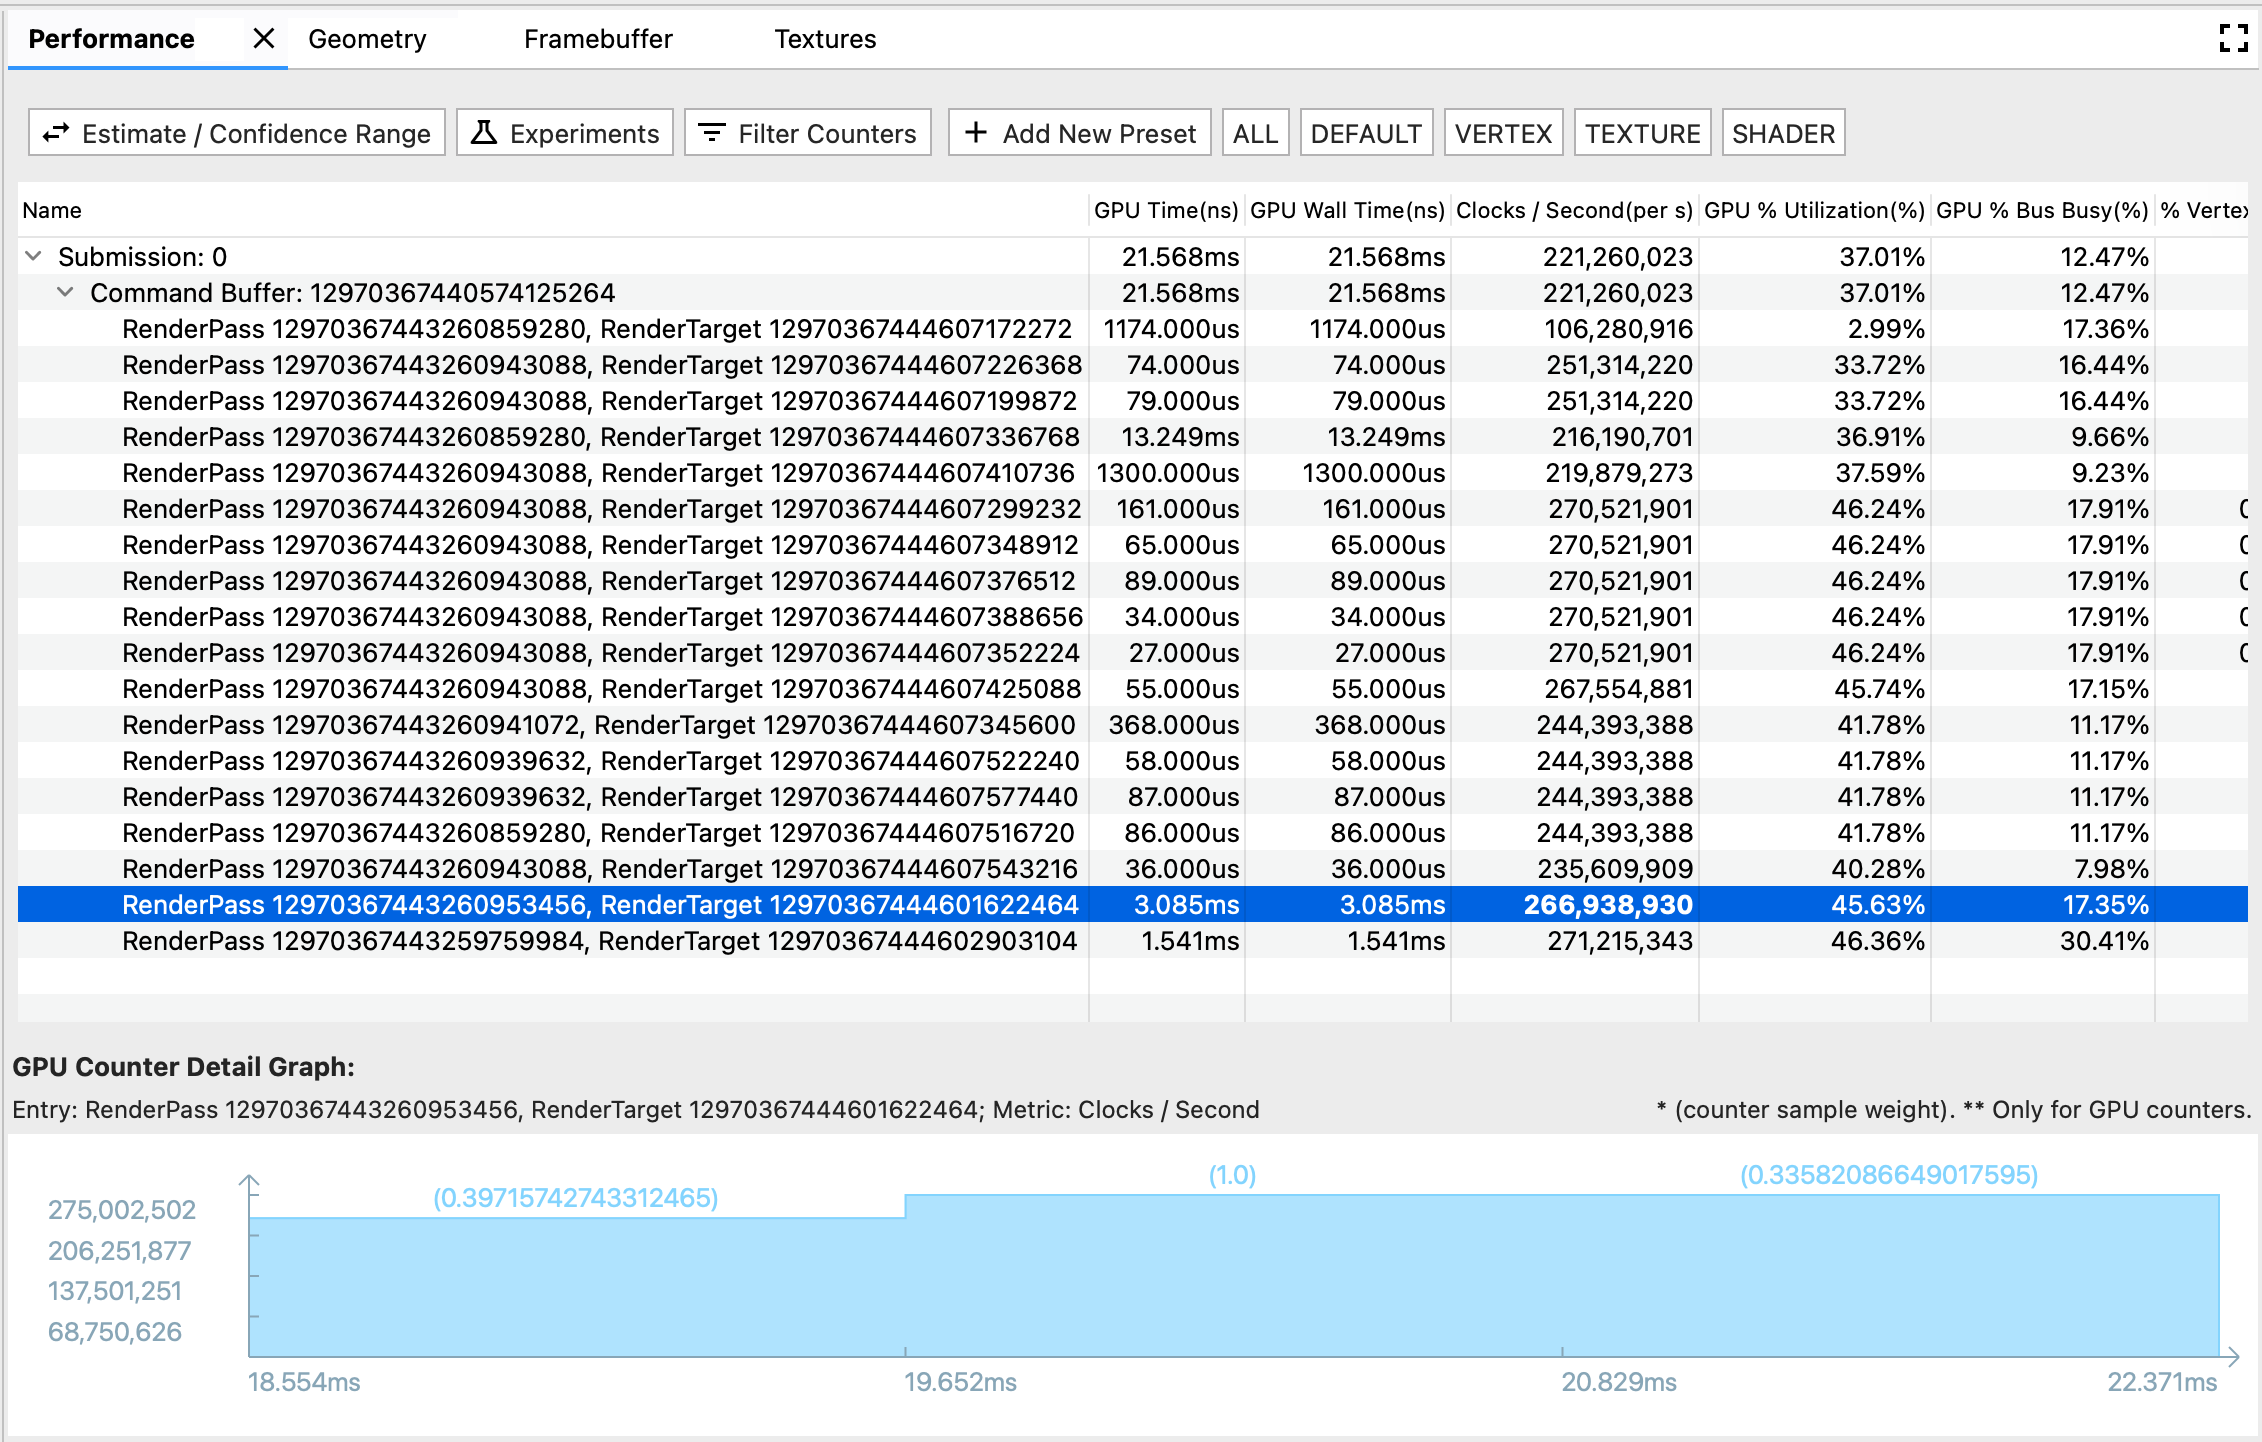
איור 1. חלונית הביצועים
בחלונית Performance (ביצועים) מוצגים ביצועי ה-GPU לאירועי רינדור שונים.
יש שלושה רכיבים בחלונית הזו:
סרגל הכלים: מכיל לחצנים פונקציונליים להתאמה אישית של טבלת הביצועים או להפעלת ניסוי.
טבלת הביצועים: התצוגה הטבלאית הראשית בכרטיסייה ביצועים. כל שורה מייצגת אירוע עיבוד, וכל עמודה מייצגת מדד של GPU (זמן GPU או מונה GPU). בדרך הזו, תא מספרי ספציפי מייצג את הביצועים של מדד ספציפי של GPU באירוע רינדור ספציפי.
תרשים פרטים של מונה GPU: מציג בפירוט את התנודות של מדד GPU בזמן שבו מתרחש אירוע עיבוד. התרשים מתעדכן רק לגבי מדדי מונה של GPU, ולא לגבי מדדי זמן של GPU, כי מדד הזמן מובן מאליו ולא משתנה עם הזמן.
סרגל כלים
הלחצן הערכה / טווח מהימנות: משנה את אופן הצגת מספר הביצועים. דגימות של מונה GPU נסקרות בקצב שלהן, ולכן יכול להיות שמשך הזמן שלהן לא יתאים בדיוק למשך הזמן של אירוע רינדור. אם יש חפיפה חלקית בין הדגימות, יכולות להיות כמה פרשנויות לגבי מידת התרומה של דגימת הדלפק לאירוע הרינדור, החל מאפס תרומה ועד לתרומה מלאה. על סמך המקרים הקיצוניים, חישבנו את טווח המהימנות, ועל סמך המשקל של הזמן החופף, חישבנו את ההערכה.
ניסוי: פותח תיבת דו-שיח לבחירת הניסוי שרוצים להריץ. ה-AGI נותן לכם אפשרויות לנסות כמה שיטות נפוצות לאופטימיזציה בלי שתצטרכו לקמפל מחדש את האפליקציה. כשמפעילים ניסוי, AGI מפעיל מחדש את הפריים על סמך ההגדרה החדשה ומעדכן את טבלת הביצועים של ה-GPU בהתאם.
מסננים של מוניטורים: פתיחת תיבת דו-שיח לבחירת עמודות המדדים שרוצים להציג בטבלת הביצועים.
סרגל ההגדרות הקבועות מראש: כולל את הכפתור הוספת הגדרה קבועה מראש חדשה עם הכפתורים הבאים של הגדרות קבועות מראש בהתאמה אישית. הגדרה קבועה מראש היא שילוב מוגדר מראש של מדדי GPU. כשלוחצים על לחצן של הגדרה קבועה מראש, בטבלת הביצועים מוצגת רשימה מסוננת של המדדים המוגדרים מראש. אפשר גם לנהל את ההגדרות הקבועות מראש בתיבת הדו-שיח הוספת הגדרה קבועה מראש חדשה.
טבלת ביצועים
הטבלה הזו מקושרת לחלונית פרופיל ולחלונית פקודה. לאירוע עיבוד יש שלושה פורמטים של ייצוג במעקב: שורה בחלונית Performance, פרוסה בחלונית Profile וצומת בחלונית Command. כדי להקל על הגלישה, כשבוחרים אחד מהפורמטים, שני הפורמטים האחרים מסומנים גם הם. לדוגמה, אם אתם רוצים לראות את הפלח הכי ארוך בחלונית פרופיל, אתם יכולים לבחור אותו ולעבור לשורה ביצועים שמודגשת כדי לראות את הביצועים המפורטים של מונה ה-GPU עבור האירוע הזה.
תרשים פרטים של מונה GPU
בציר ה-X מוצגות חותמות הזמן של דגימות המונה. שימו לב שהזמן מבוסס על שעת ההתחלה של אירוע הרינדור הראשון, ולכן לפעמים יכול להיות שתראו חותמת זמן שלילית בתרשים הפרטים של המונה עבור הדגימה הראשונה של המונה, שחופפת חלקית לאירוע הרינדור הראשון.
בציר ה-y מוצג ערך הביצועים של מדד דגימות המונה.
המספר בסוגריים מעל כל עמודה מראה את המשקל של דגימת המונה, או את מידת התרומה של הדגימה לאירוע העיבוד, בתרחיש המשוער.
דוגמאות התוכן והקוד שבדף הזה כפופות לרישיונות המפורטים בקטע רישיון לתוכן. Java ו-OpenJDK הם סימנים מסחריים או סימנים מסחריים רשומים של חברת Oracle ו/או של השותפים העצמאיים שלה.
עדכון אחרון: 2025-07-27 (שעון UTC).
[null,null,["עדכון אחרון: 2025-07-27 (שעון UTC)."],[],[],null,["# Performance pane\n\n**Figure 1.**Performance pane\n\nThe **Performance** pane displays GPU performance for different rendering events.\n\nThere are three components in this pane:\n\n- Toolbar: contains functional buttons for customizing the **Performance Table** or kicking off an experiment.\n- **Performance Table** : **Performance** tab's main tabular view. Each row represents a rendering event, and each column represents a GPU metric (GPU time or GPU counter). In this way, a specific numerical cell represents the specific GPU metric's performance at the specific rendering event.\n- **GPU Counter Detail Graph**: displays in detail how a GPU metric fluctuates during the time when a rendering event happens. The graph only refreshes for GPU counter metrics but not for GPU time metrics, since the time metric is self-explaining and doesn't fluctuate with time.\n\nToolbar\n-------\n\n- **Estimate / Confidence Range** button: toggles how the performance number is shown. Since GPU counter samples are polled at their own pace, its timeframe may not align perfectly with a rendering event's timeframe. When they are partially overlapped, there may be multiple interpretations of how much the counter sample contributes to the rendering event, ranging from zero contribution to full contribution. Based on the edge cases, we calculated the **Confidence Range** ; and based on overlapped time's weight, we calculated the **Estimate**.\n- **Experiment**: opens a dialog for choosing the experiment you'd like to run. AGI give you options to try out some common optimization practices with no need of re-compiling your application. When you kick off an experiment, AGI replays the frame based with the new setting, and update the GPU performance table accordingly.\n- **Filter Counters** : opens a dialog for choosing which metric columns you'd like to show in the **Performance Table**.\n- **Presets Bar** : composed by an **Add New Preset** button with following customized preset buttons. A preset is a pre-defined combination of GPU metrics. When you click a preset button, the **Performance Table** shows a filtered list of the pre-defined metrics. You can also manage presets in the **Add New Preset** dialog.\n\nPerformance Table\n-----------------\n\nThis table links with **Profile** pane and **Command** pane. A rendering event has three representation formats in a trace: a row in **Performance** pane, a slice in **Profile** pane, and a node in **Command** pane. To make it easier for browsing, when you select either one of the formats, the other two are highlighted as well. For example, if you are interested in the longest slice in **Profile** pane, you could select it, and navigate to the highlighted **Performance** row to look at detailed GPU counter performances for this event.\n\nGPU counter detail graph\n------------------------\n\n- The x-axis shows counter samples' timestamps. Note that the time is based on the start time of the very first rendering event, so sometimes you may see negative timestamp in the counter detail graph for the first counter sample, which partially overlaps with the first rendering event.\n- The y-axis shows counter samples' metric performance value.\n- The parenthesized number above each bar shows the counter sample's weight, or how much contribution we consider the sample provides towards the rendering event, in the estimated scenario."]]