Estimating CPU and GPU frame processing times (or frame times) is essential for understanding your app's performance and finding potential bottlenecks. When you use the System Profiler in Android Performance Analyzer to record a system trace, the resulting trace view provides data that you can use to estimate frame times.
Measure CPU frame times
In the System Profiler, you can view the total and active CPU frame times in the process tracks.
Total CPU time
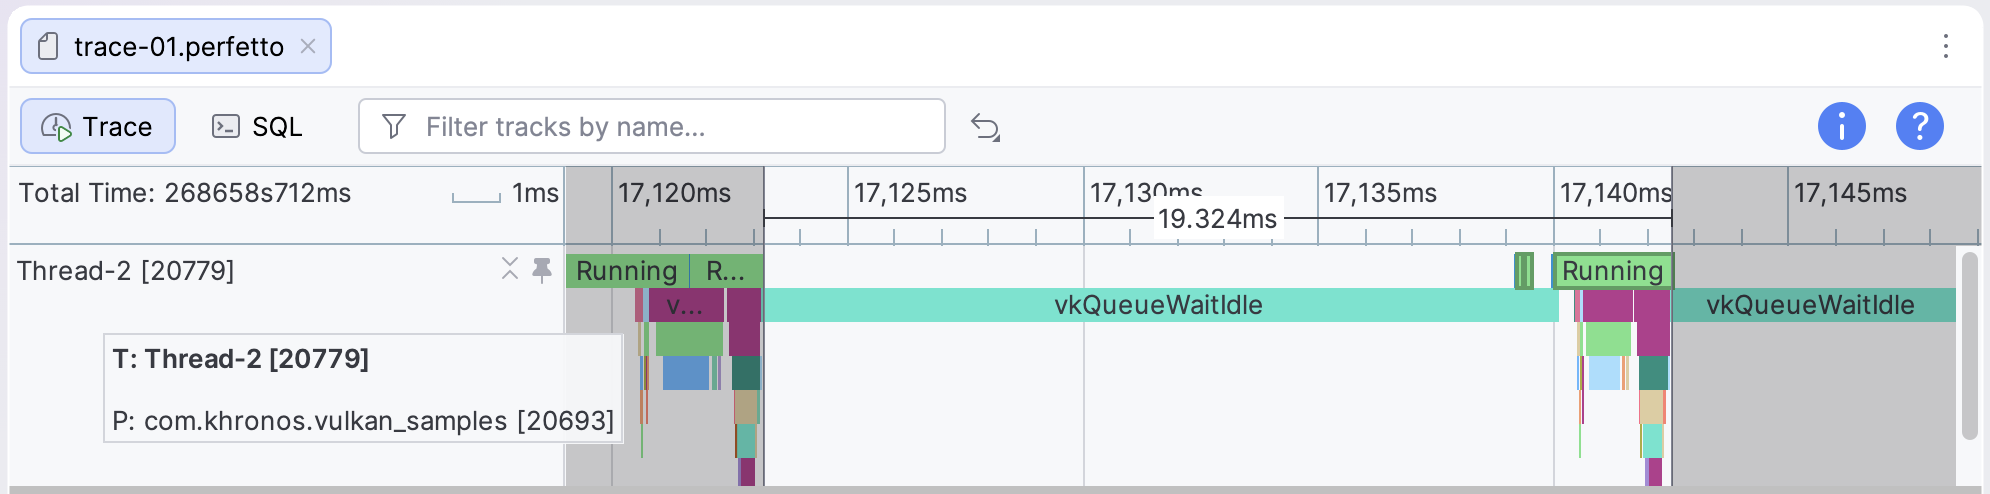
To measure the total CPU time for a frame, select the time range
between successive frame submission events. For Vulkan, the frame submission
events are named vkQueuePresentKHR.
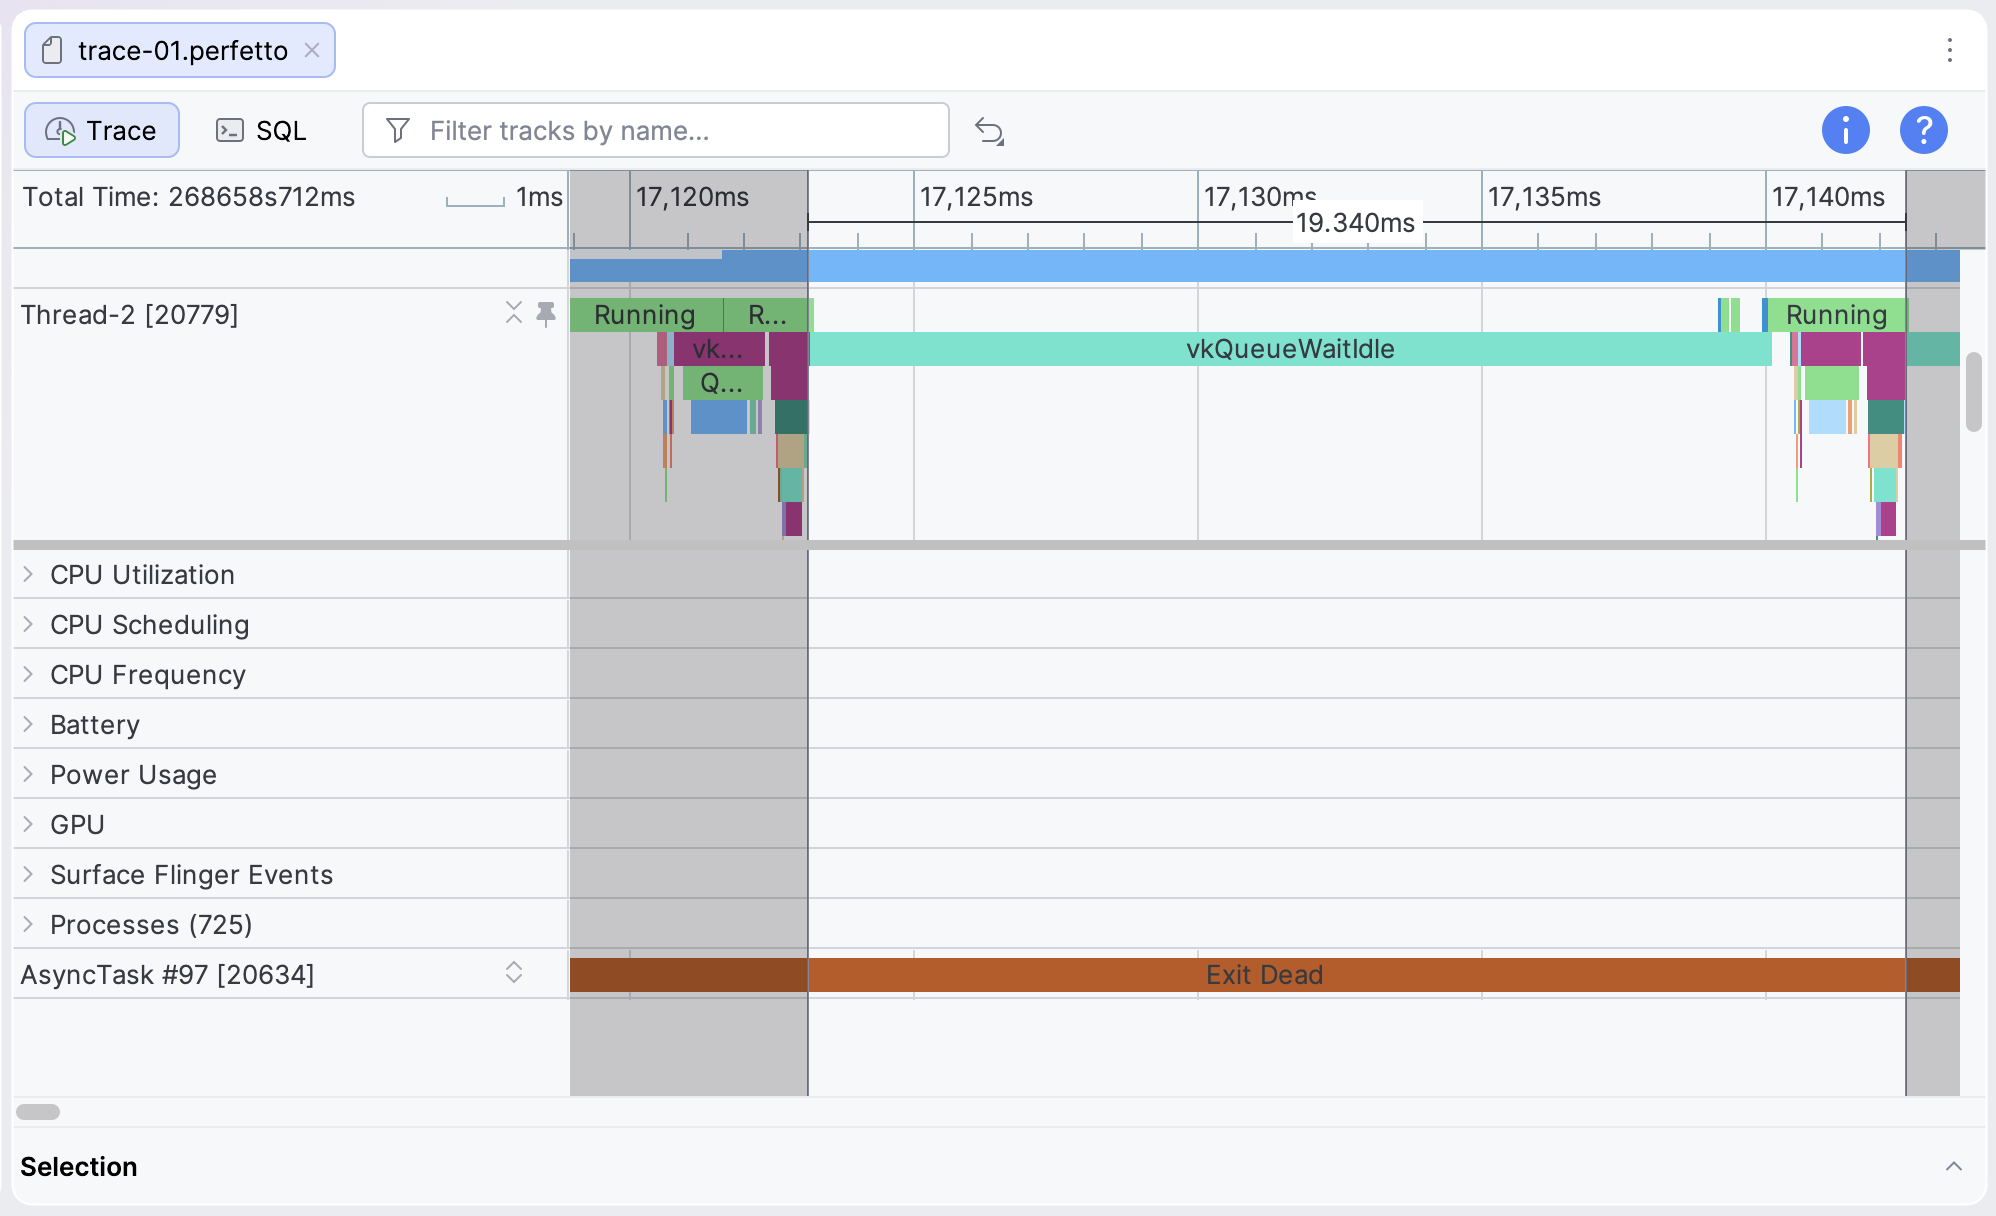
vkQueuePresentKHR events on a thread track.This measurement is an estimate of the total CPU time, but doesn't necessarily
represent the active CPU time. For example, in GPU-bound apps, the CPU might
wait for the GPU to complete its work before submitting a new frame. This often
happens when a dequeueBuffer or vkQueuePresent (for Vulkan) event takes up a
large portion of the CPU time. The wait time is included in the total CPU time,
but not the active CPU time.
Active CPU time
Active CPU time is the time when the CPU is running the app code without being in an idle state.
To measure the active CPU time, view the Running slices in the thread track
just above the CPU events. Count all portions of the trace that are in a
Running state between the two frame submission events. Make sure you include
working threads.
Running slices
used to measure the active CPU time.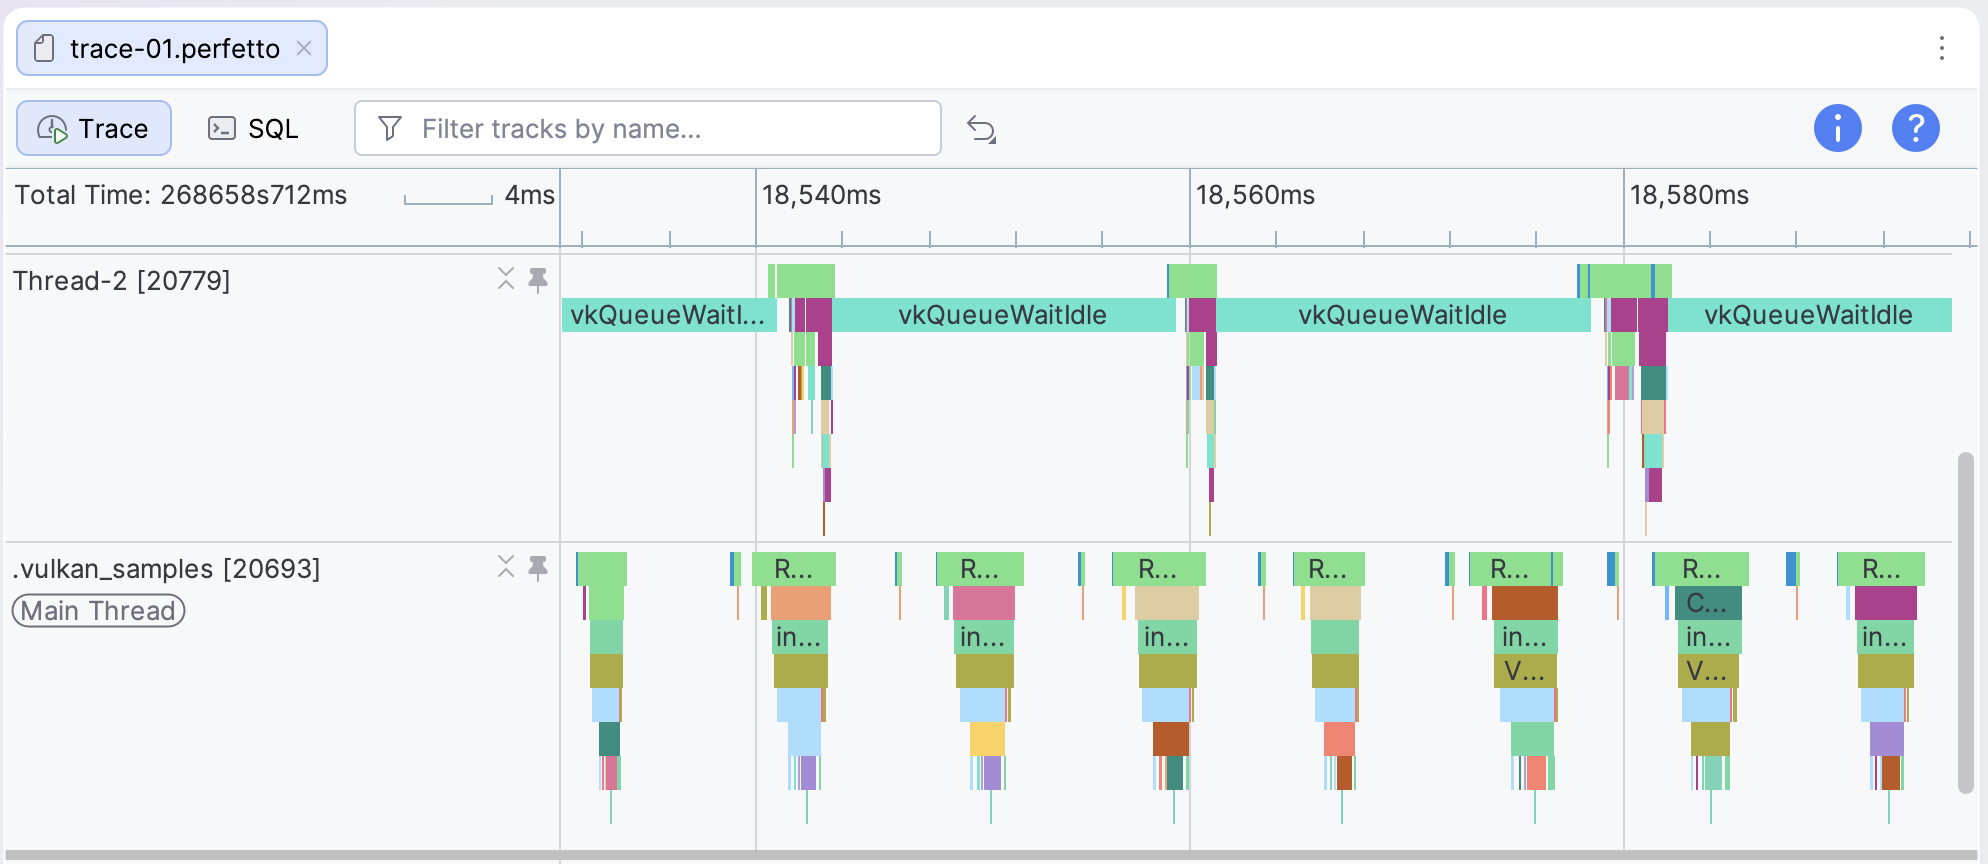
Estimate GPU frame times
The most accurate way to estimate GPU frame times is to use GPU slices, but if tracing GPU slices isn't supported for your test device, then you can also use GPU counters. The System Profiler in Android Performance Analyzer supports both approaches.
Estimate with GPU slices
If GPU slice information is available in your trace data, you can get very accurate GPU frame time information by measuring the total amount of time your app spends working on tasks that are associated with a single frame.
Adreno
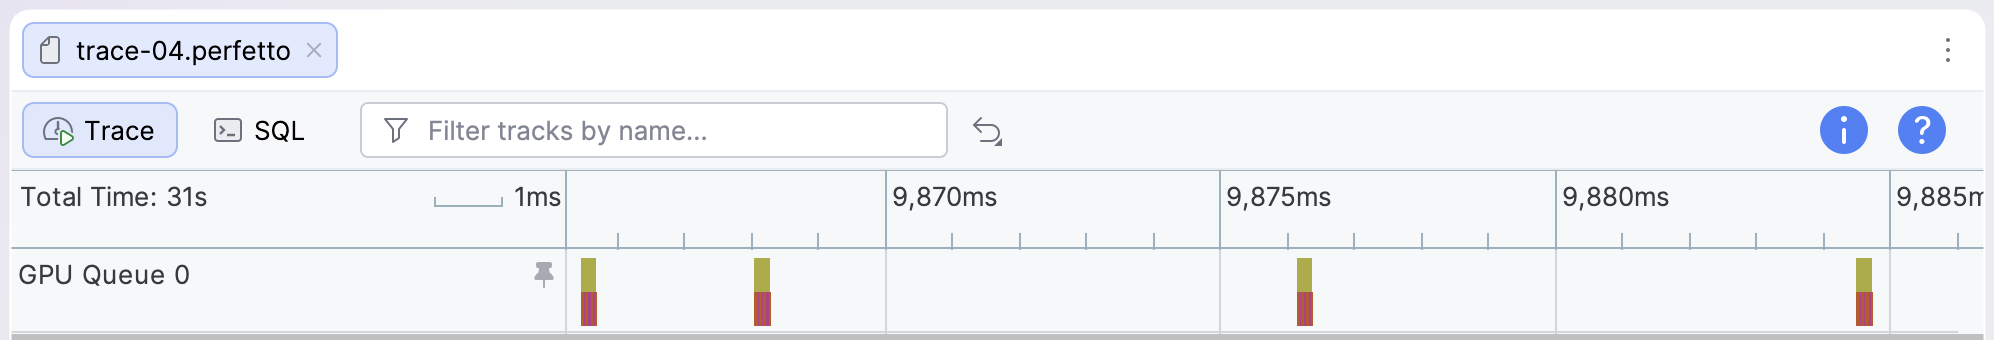
On Adreno devices, GPU slices appear in the GPU Queue 0track and are always represented sequentially, so you can look at all the slices that represent the render passes for a frame and use them to measure GPU frame times.
Mali
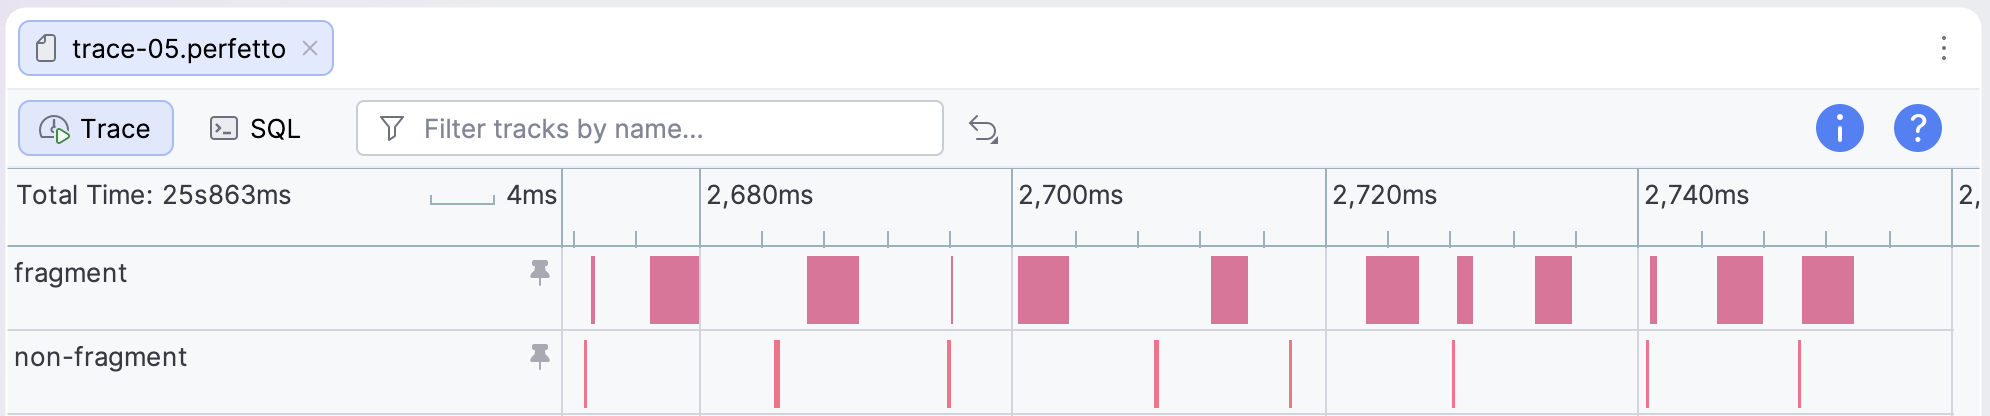
On Mali devices, GPU slices have fragment, non-fragment, and sometimes supplementary non-fragment tracks. The fragment and non-fragment work is sequential for less complex frames, so distinguishing one frame's work from another can be done by looking for gaps between active GPU work.
For apps and games that have a more heavily-parallelized GPU workflow, you
can get the GPU frame times by looking for all of the frames that have the
same submissionID value in the detail view for each slice.
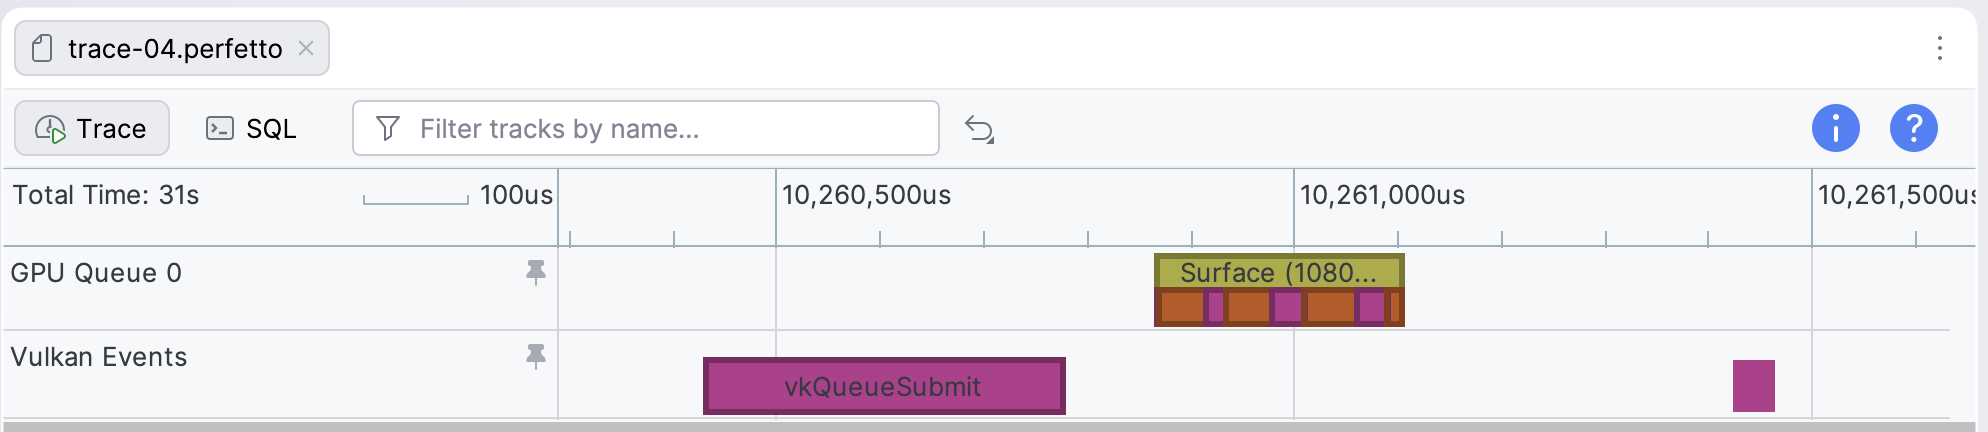
For Vulkan-based apps, multiple submissions can be used to compose a frame. Keep track of the submission IDs by using the Vulkan Events track, which contains a slice for each submission. Selecting a submission slice highlights all the GPU activity slices that correspond to the submission.
To trace complex submissions back to specific engine subsystems, assign
distinct, descriptive names to your render pass objects using object naming
extensions like vkSetDebugUtilsObjectNameEXT. Then, enable the Render Pass
Debug Names (Experimental) Vulkan layer when configuring your trace.
Estimate with GPU counters
If GPU slice information isn't available in a trace or isn't appropriate for your needs, you can also estimate the GPU frame time using the GPU counter tracks.
Adreno
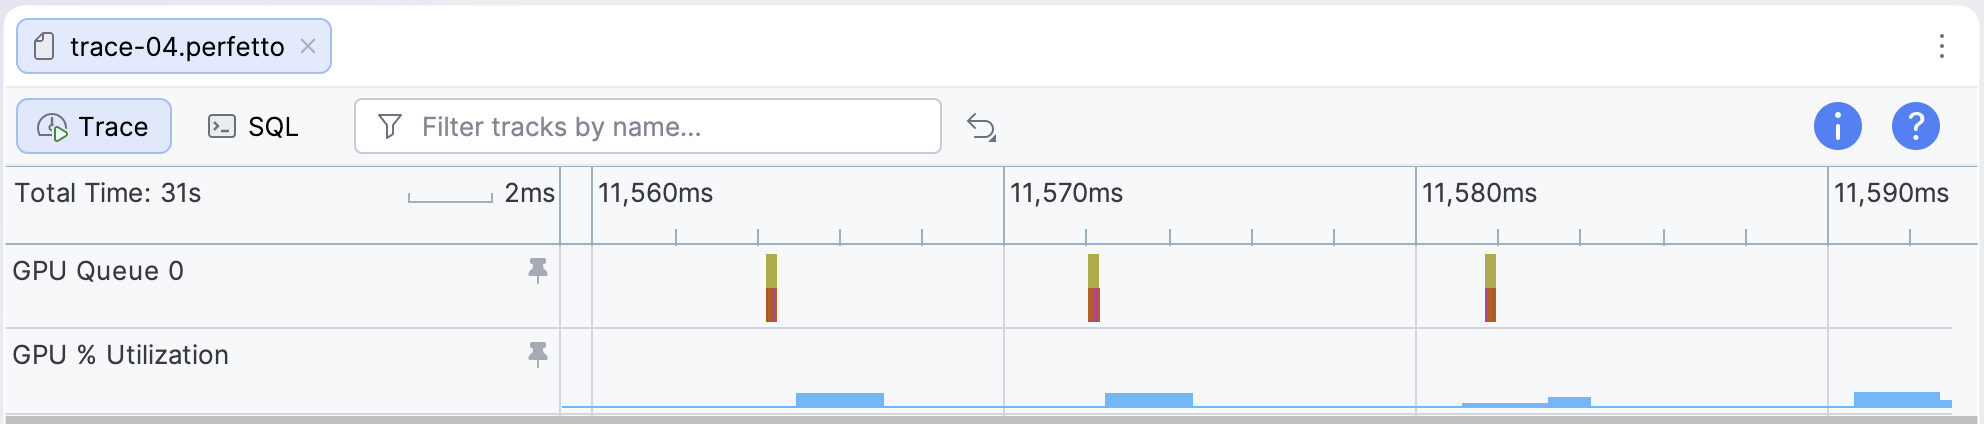
For apps that aren't GPU intensive, you can use the GPU % Utilization counter track to estimate the GPU frame time. When apps are less GPU intensive, they have regular periods of high and low GPU activity, instead of consistently high activity. To estimate the GPU frame times using this track, measure the duration of high activity periods in the track.
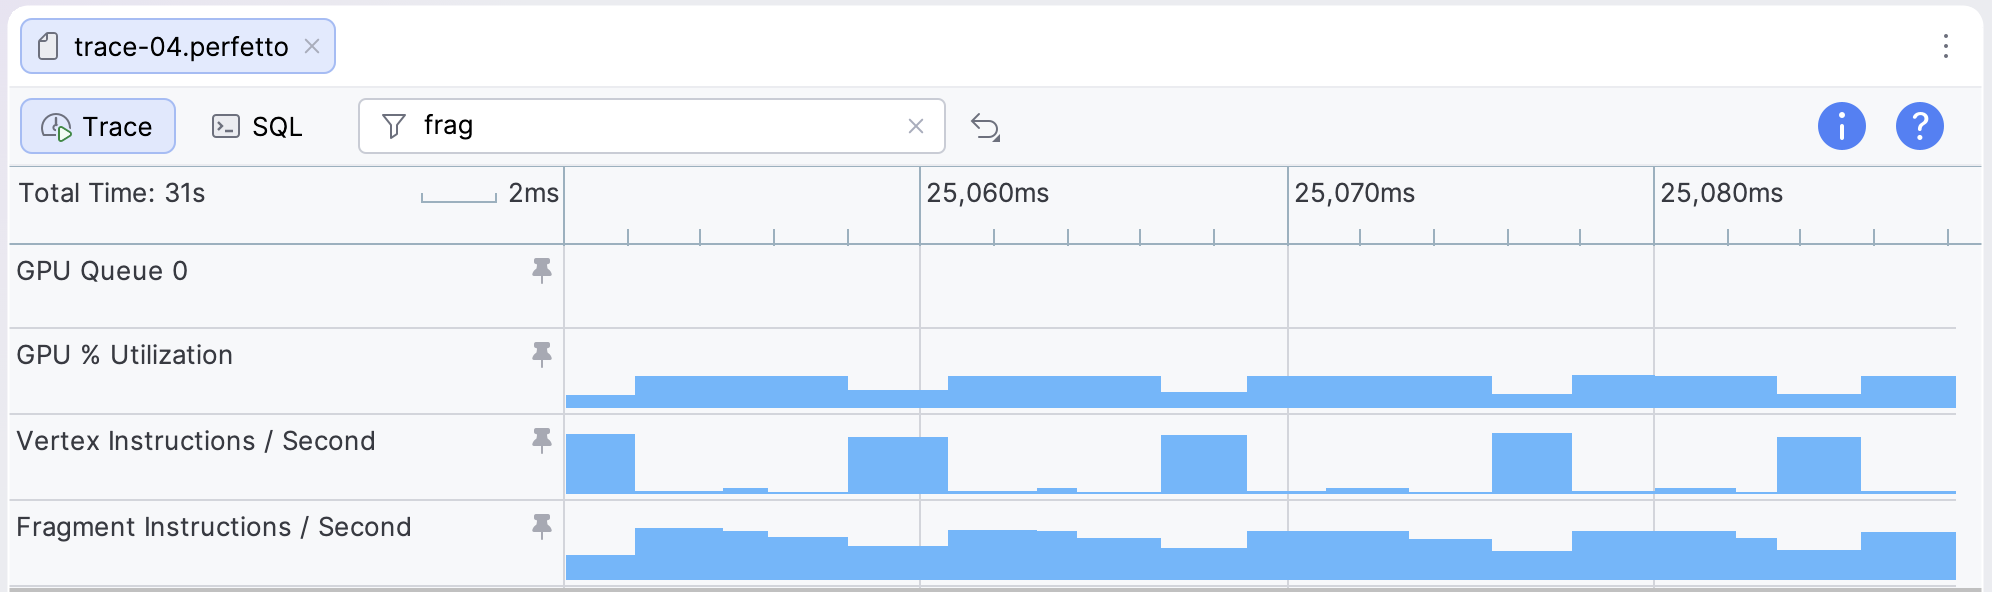
For apps or games that are GPU intensive, the GPU utilization can be consistently very high. In this case, you can use the Vertex Instructions/Second and Fragment Instructions/Second counter tracks to monitor GPU activity and estimate GPU frame times. By looking for patterns in these tracks, you can get a rough estimate of where the boundaries of the frame are.
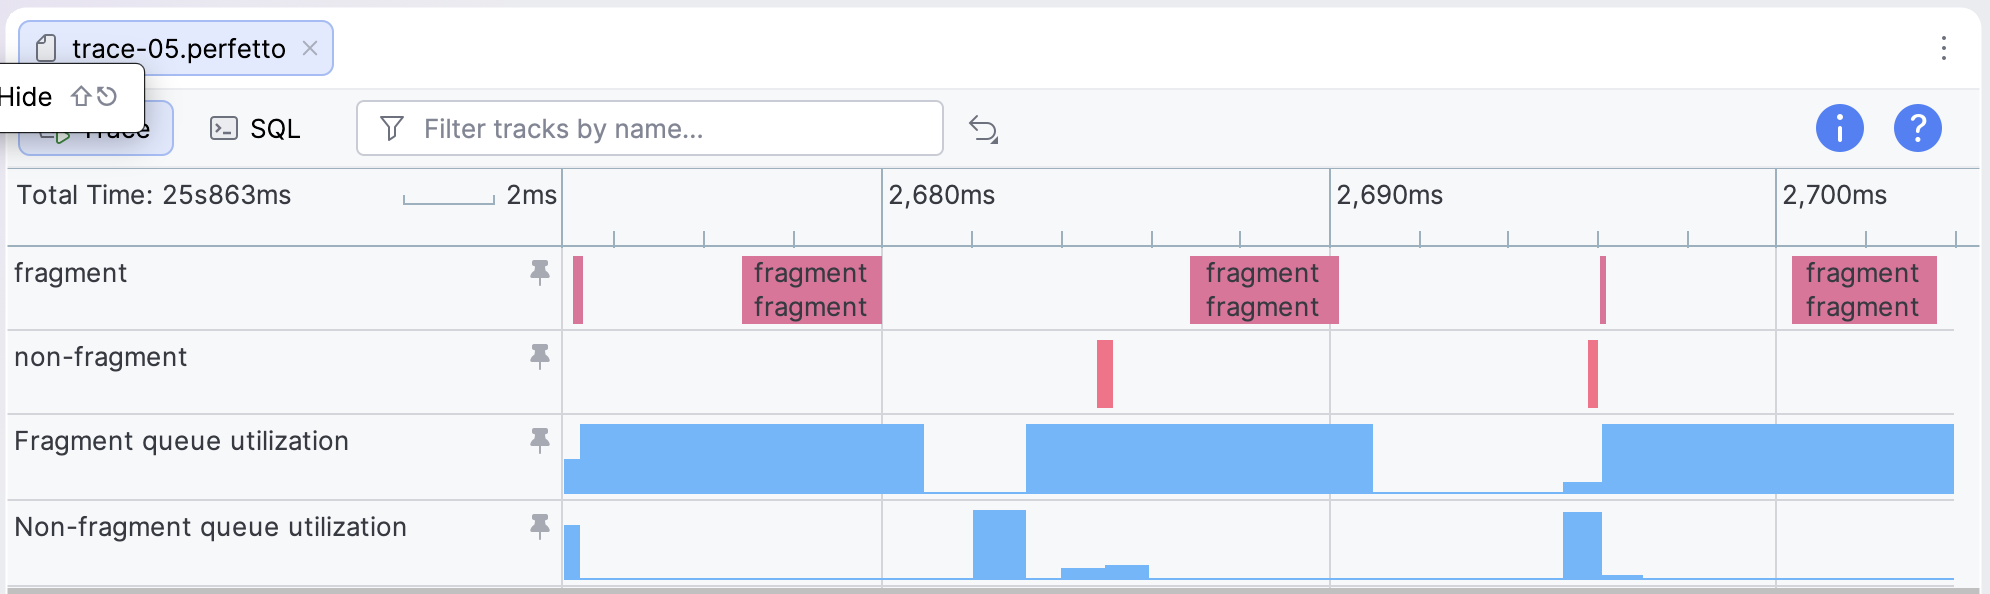
Mali
For apps that aren't GPU intensive, you can use the GPU utilization counter track to estimate the GPU frame time. When apps are less GPU intensive, they have regular periods of high and low GPU activity, instead of consistently high activity. To estimate the GPU frame times using this track, measure the duration of high activity periods in the track.
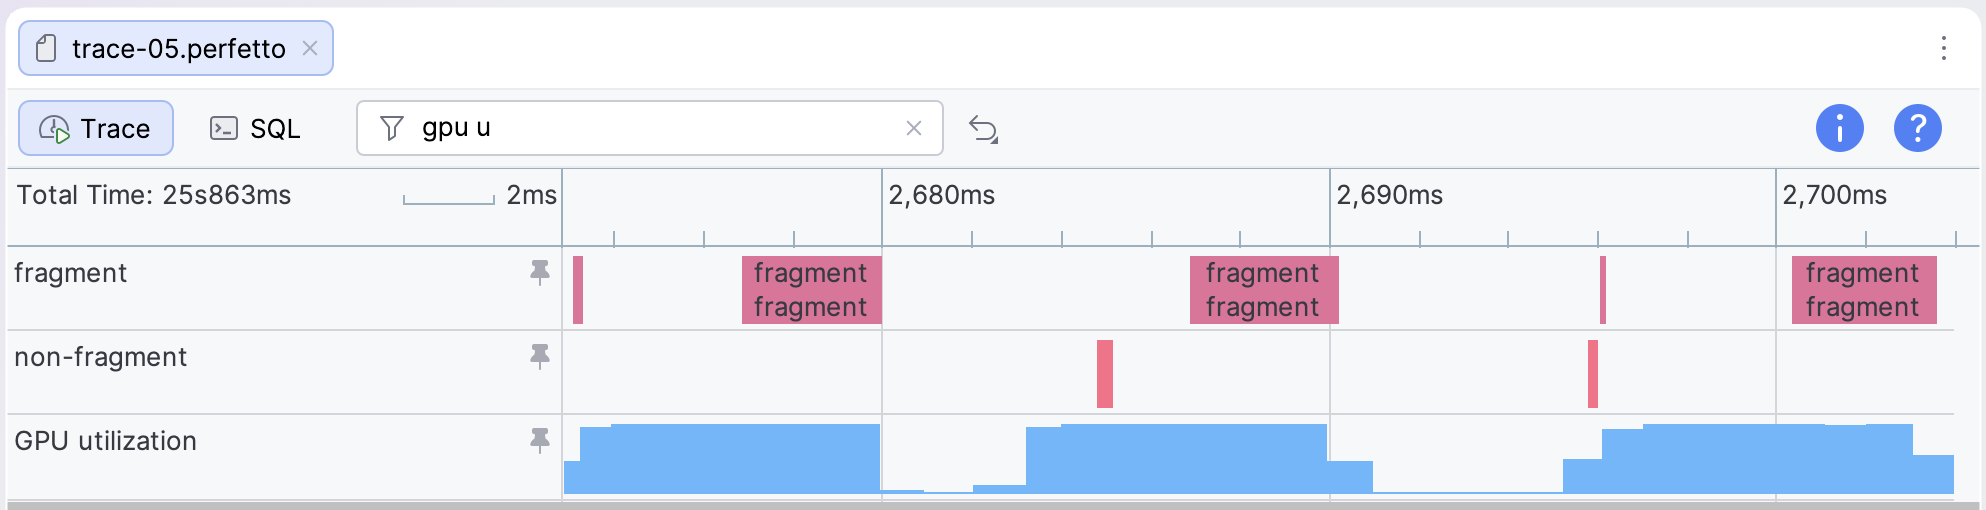
For apps or games that are GPU intensive, the GPU utilization can be consistently very high. In this case, you can use the Fragment queue utilization and Non-fragment queue utilization counter tracks to monitor GPU activity and estimate GPU frame times. By looking for patterns in these tracks, you can get a rough estimate of where the boundaries of the frame are.