
本指南介绍了在 Android 设备上分析和优化游戏性能的流程,以实现流畅的用户体验。它涵盖了识别性能瓶颈、区分 CPU 和 GPU 问题,以及验证优化结果。
无论游戏多么有趣或吸引人,如果无法在移动设备上流畅运行,玩家就不会喜欢,游戏也不会那么成功。即使是好玩的游戏也可能会出现每秒帧数 (FPS) 低或设备过热等问题。这些问题会让玩家感到不快。因此,提升游戏性能至关重要,您必须了解如何优化游戏性能。
性能优化流程包括以下步骤:
衡量游戏的整体性能。量化每个场景的性能降幅,以精确定位异常情况。
CPU 和 GPU 绑定检查。确定根本原因,无论是 CPU 限制还是 GPU 限制。
工具:Unreal Insight、Unity Profiler、Perfetto 和性能测量工具。
CPU 优化。纠正发现的性能瓶颈。
工具:Unreal Insight、Unity Profiler、Perfetto 和 Simpleperf。
GPU 优化。纠正发现的性能瓶颈。
工具:RenderDoc、Arm Mobile Studio、AGI、供应商专用工具。
A/B 测试。进行 A/B 测试,以严格验证所实施的优化措施的有效性。
工具:Unreal Insight、Unity Profiler、Perfetto 和性能测量工具、CPU 或 GPU 频率锁定以及 RenderDoc。
此迭代过程 (1-5) 会一直持续,直到成功实现目标 FPS 和热参数。
前提条件
准备好游戏 build,以便在 Android 设备上进行测试。
安装以下工具:
分析全面的游戏表现
您必须检查游戏的整体性能,并确定任何基于场景的性能下降或异常情况。在优化游戏之前,请先检查游戏的当前性能。由于游戏包含许多界面和场景,因此请分析 CPU 或 GPU 使用率较高的场景或性能出乎意料的布局,以监控每个场景的性能下降情况和 CPU 或 GPU 利用率。
- 量化性能降幅:使用性能测量工具来测量游戏的整体性能。按场景衡量性能,以找出性能下降或出现异常的具体区域。
- 找出有问题的场景:分析数据,找出 CPU 或 GPU 使用率高的场景,或屏幕布局无法产生预期性能的场景。
- 收集轨迹数据:使用轨迹工具收集已发现的问题场景的详细性能数据。
确定 CPU 或 GPU 瓶颈
如果游戏未达到目标 FPS,请确定它是受 CPU 限制还是受 GPU 限制。分析 CPU 和 GPU 行为对于寻找优化机会至关重要,即使设备在游戏过程中发热或耗电过多也是如此。您可以使用各种方法来确定系统是受 CPU 限制还是受 GPU 限制。
分析跟踪数据:使用您偏好的工具分析跟踪数据:
- Unreal Insight (Unreal Engine):分析轨迹以查看
GameThread、RenderThread和RHIThread的时间安排。- 如果
GameThread或RenderThread超过帧时间限制(例如,30 FPS 时为 33.3 毫秒),则游戏为 CPU 受限。 - 如果
RHIThread表现出长时间执行或占帧时间的大部分,则游戏是 GPU 绑定的。
- 如果
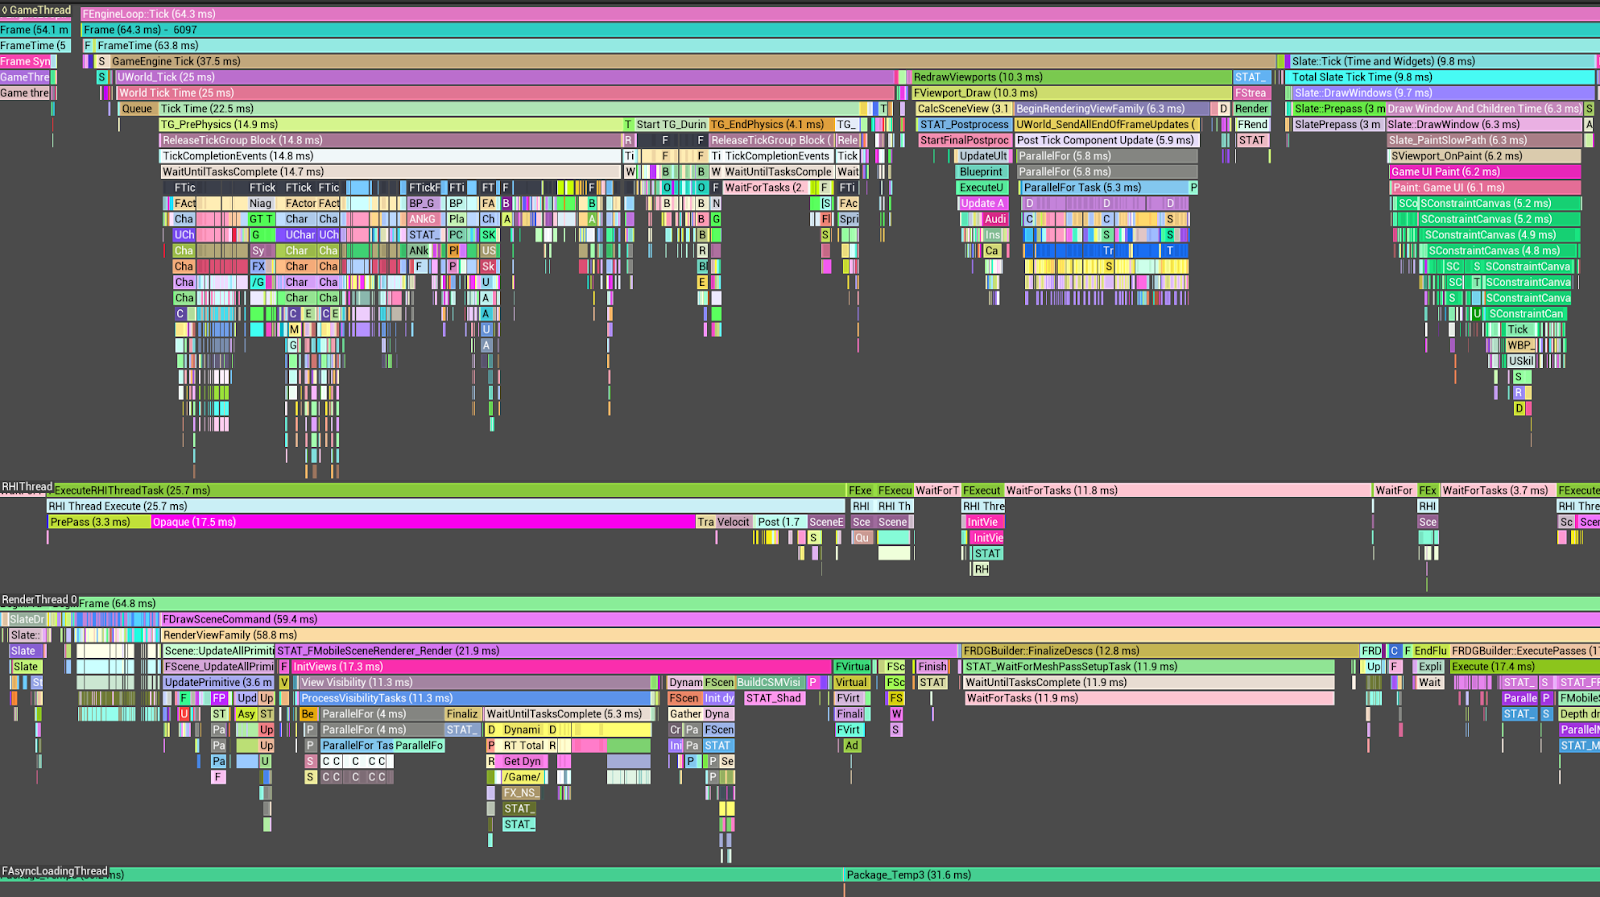
图 2. 包含 GameThread、RenderThread 和 RHIThread 的 Unreal 洞见轨迹(点击可放大)。 - Unity 分析器 (Unity):如果主线程在
Gfx.WaitForPresentOnGfxThread等标记上消耗大量时间,而渲染线程显示Gfx.PresentFrame或<GraphicsAPIName>.WaitForLastPresent,则游戏属于 GPU 瓶颈。
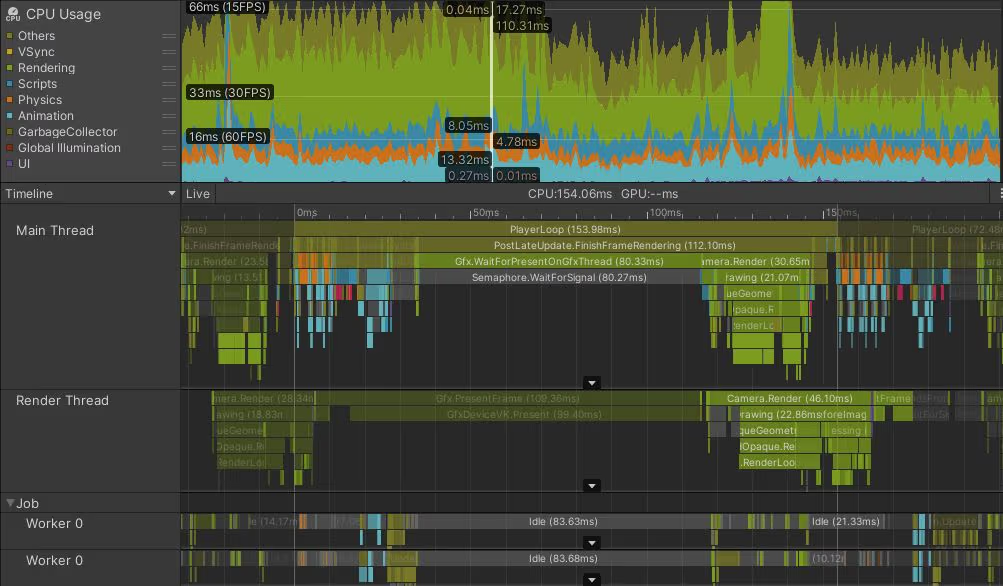
图 3. Unity 分析器的 GPU 绑定示例(点击可放大)。 - Perfetto:分析 CPU 核心分配和线程执行详情。通过详细查看线程执行信息,此分析有助于识别性能瓶颈。
CPU 开销:轨迹表明,
GameThread和RenderThread上的工作负载与 VSync 结合在一起,导致 RHI 线程的QueuePresent出现延迟,从而表明这是一个受 CPU 限制的场景。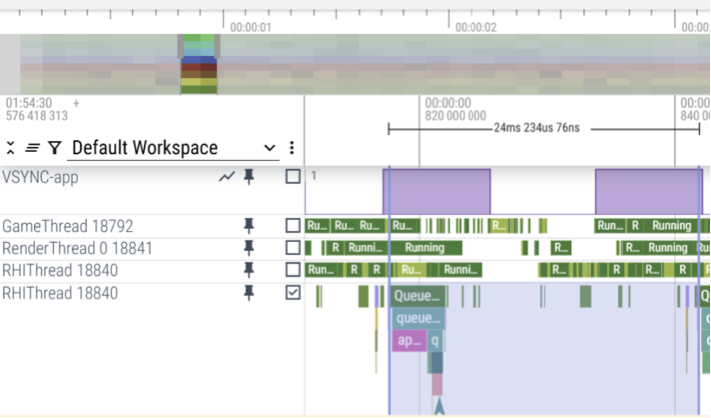
图 4. 包含 CPU 执行详细信息的 Perfetto 轨迹(点击可放大)。 GPU 开销:如果 GPU 完成时间超过帧时间限制(例如 25 毫秒),则游戏会受到 GPU 限制。轨迹表明 GPU 完成时间超过 25 毫秒,这表示属于 GPU 绑定场景。
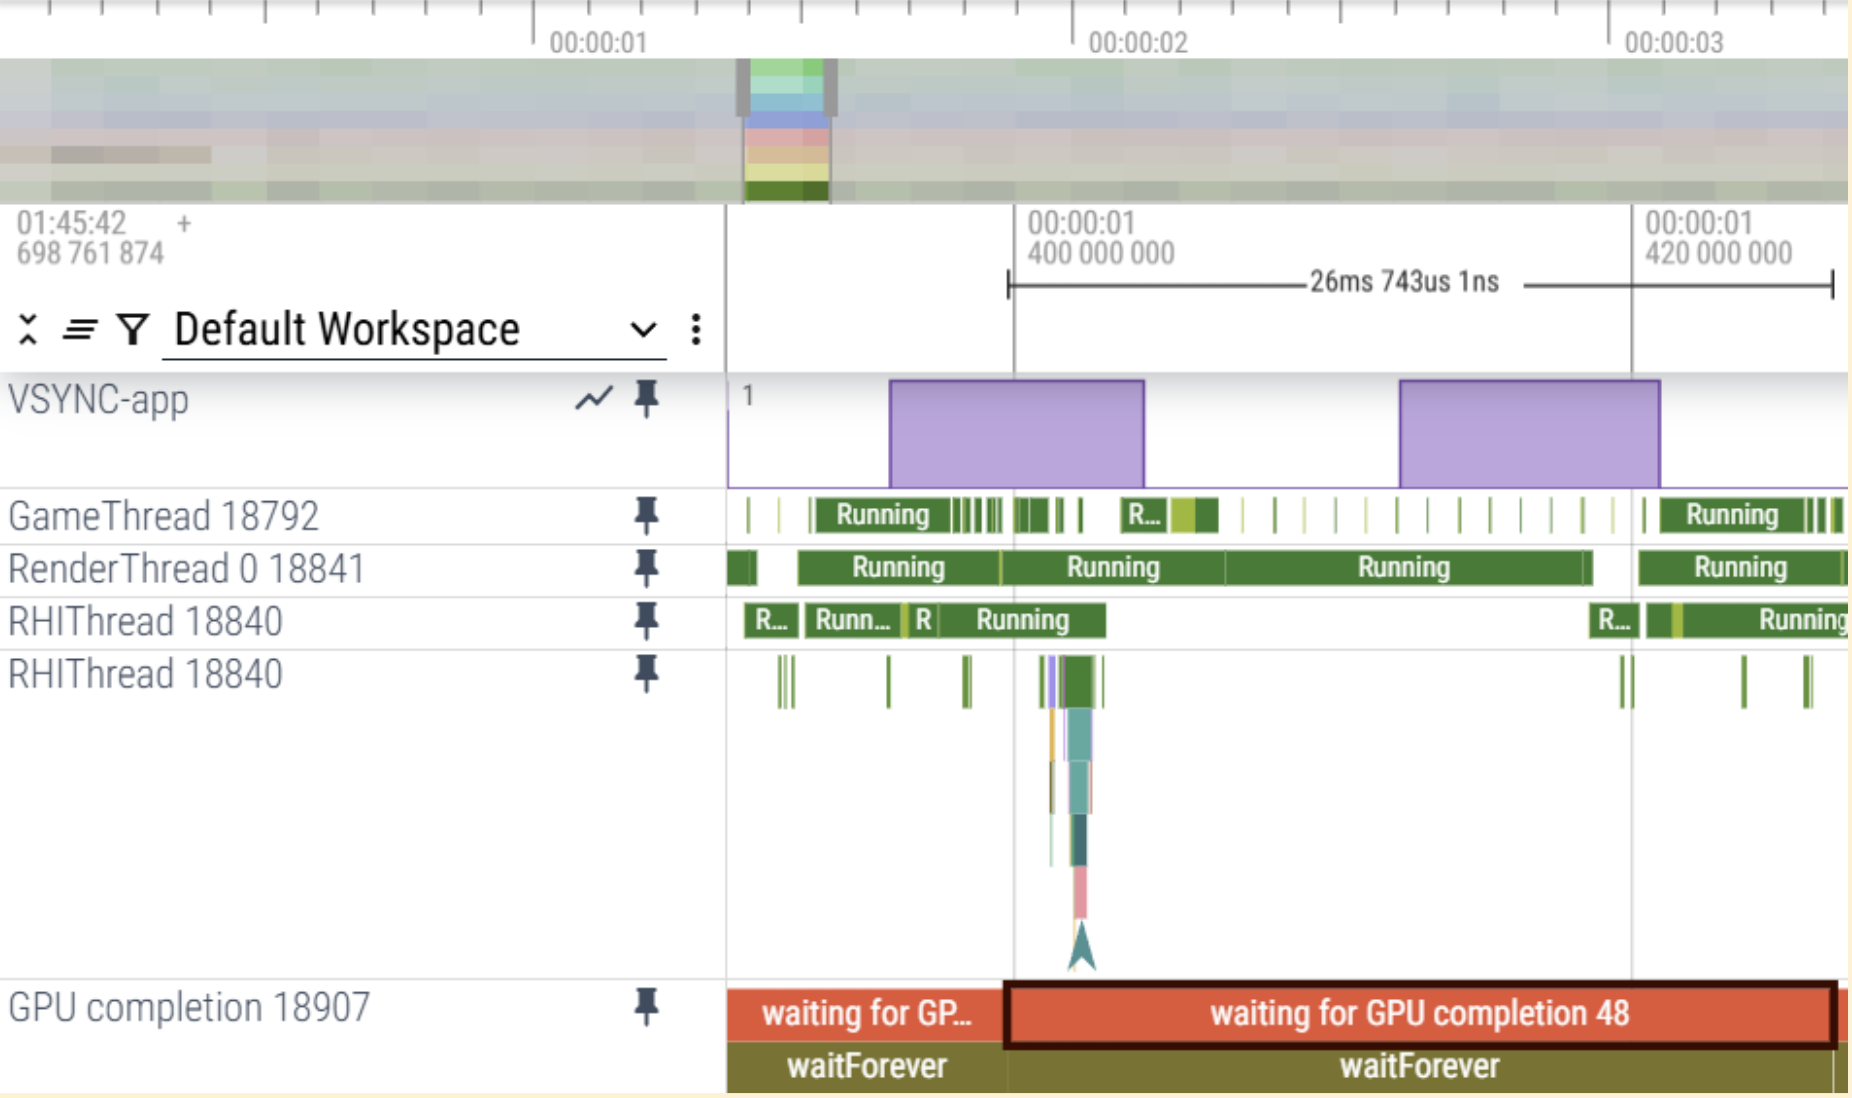
图 5. 包含 GPU 开销详细信息的 Perfetto 轨迹(点击可放大)。
- Unreal Insight (Unreal Engine):分析轨迹以查看
使用 Unreal Engine 统计信息命令:
stat unit:比较分配给游戏、绘制和 RHI 线程的时间。 如果游戏时间和绘制时间较低,但 RHI 时间始终超过帧时间限制,则游戏受 GPU 限制。例如,如果所需的 FPS 为 30(相当于每帧 33.33 毫秒),并且游戏线程和绘制线程始终保持在 10-15 毫秒范围内,但 RHI 始终超过 30 毫秒,则强烈表明存在 GPU 瓶颈。
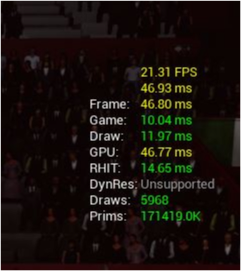
图 6. 统计单位有助于估计 GPU 绑定条件。 stat VulkanRHI:检查队列提交和队列呈现时长。
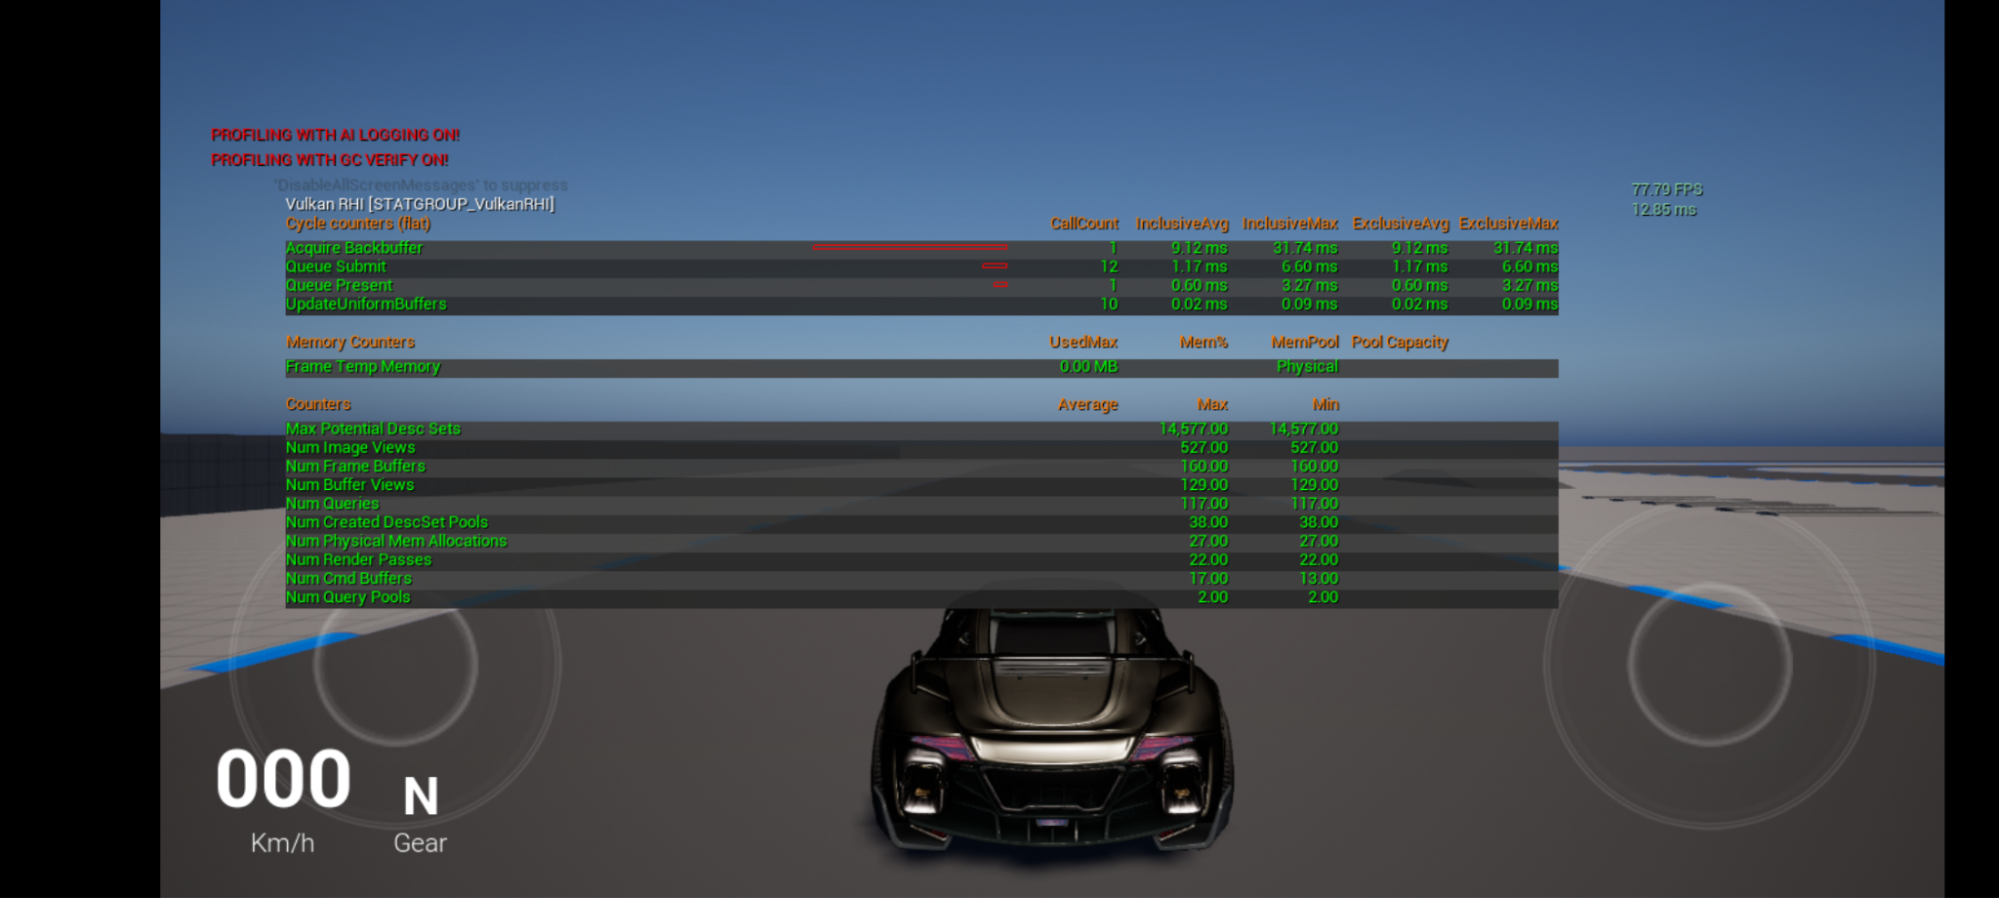
图 7. Stat VulkanRHI 有助于估计 GPU 绑定条件(点击可放大)。 stat slow:仔细检查分配给游戏、渲染和 RHI 线程的时间,以找出阻碍因素。
查看效果指标:使用全面的游戏效果分析结果。在 Android 设备上:
- CPU 受限:CPU(已归一化)使用率高于 15%,但 GPU 使用率和 FPS 较低。
- 受 GPU 限制:GPU 使用率高于 90%。
通常,如果 FPS 和 GPU 使用率较低,而 CPU 使用率超过 15%,则可认为这种情况属于 CPU 瓶颈。
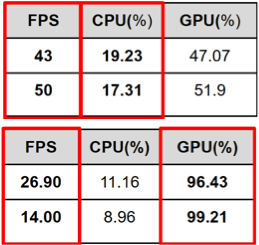
图 8. 包含 CPU 和 GPU 用量的性能指标。
优化 CPU 性能
如果分析表明游戏受 CPU 限制,请进一步调查以找出导致瓶颈的具体线程或 API。
如需详细指导,请参阅 Android 的 CPU 和 GPU 优化提示。
优化 GPU 性能
如果分析表明游戏受 GPU 限制,请使用帧调试器进一步调查,以分析渲染流水线和绘制调用。
如需详细指导,请参阅 Android 的 CPU 和 GPU 优化提示。
验证优化效果
- 进行 A/B 测试:创建已实现优化的 build。
- 衡量性能:使用初始分析中使用的相同工具和方法来衡量优化后的 build 的性能。
- 比较结果:将新的性能数据与初始数据进行比较,以确认已解决识别出的瓶颈问题,并且已达到 FPS 和散热目标。
- 迭代:重复执行分析和优化步骤,直到达到所需性能。