
If you're already familiar with system profiling, this guide provides all the information you need to meet requirements, install the software, and begin running and viewing traces with the System Profiler in Android Performance Analyzer. Otherwise, see next steps for links to more in-depth guidance.
Requirements
In order to successfully use the System Profiler to record a system trace, there are requirements that must be met by the computer running the software, the device running the app under test, and the app under test itself.
Computer requirements
The computer that runs the System Profiler must meet the following requirements:
- It must have one of the following operating systems installed:
- Windows. 64-bit Windows 10 or higher.
- macOS. macOS 12 or higher.
- Must have an ARM-based chip. Macs with Intel chips are unsupported.
- Linux.
- 64-bit machines must install the required libraries for 64-bit machines.
- It must have the Android SDK installed, including the
Platform-Tools package.
- The
ANDROID_HOMEenvironment variable must be set.
- The
Testing device requirements
The device running the app under test must meet the following requirements:
- A supported Android device running Android 12 or higher.
- A USB cable.
- Android Debug Bridge (
adb) debugging must be enabled and the device must be accessible throughadb. If the Install via USB option is present, enable it.
Device validation
To ensure a valid system trace, the System Profiler runs a validation check the first time you connect a new device. Don't disturb the device while validation is in progress. This might cause the device to fail validation. If a device fails validation but is set up correctly, you can retry validation by clicking the Retry button in the Device drop-down or by disconnecting and reconnecting the device.
After your device passes validation, a green check mark appears next to your device's name in the Configure a Recording window.
App requirements
While it's not a strict requirement, we recommend the following in order to help profiling be as useful and accurate as possible:
- Use the release version of your app or game, or a version that's built with performance options (such as compiler flags or packaging optimizations) enabled.
- If you are profiling an app or game that uses Vulkan for graphics, set the debuggable attribute in the Android manifest to true. This allows Vulkan-specific data to be included in system traces.
- For Java and Kotlin applications, set the debuggable attribute to false to allow the Android Runtime to run at maximum optimized efficiency. This helps your system traces mirror real-world performance. It doesn't make as much of a difference for pure C/C++ apps or native game loops, but managed-code apps need it in order to yield accurate profiling data.
Basic workflow
Perform the following steps to capture profiling data and open the resulting trace file for analysis:
Open Android Performance Analyzer and either select an existing project or click New Project to create a new project.
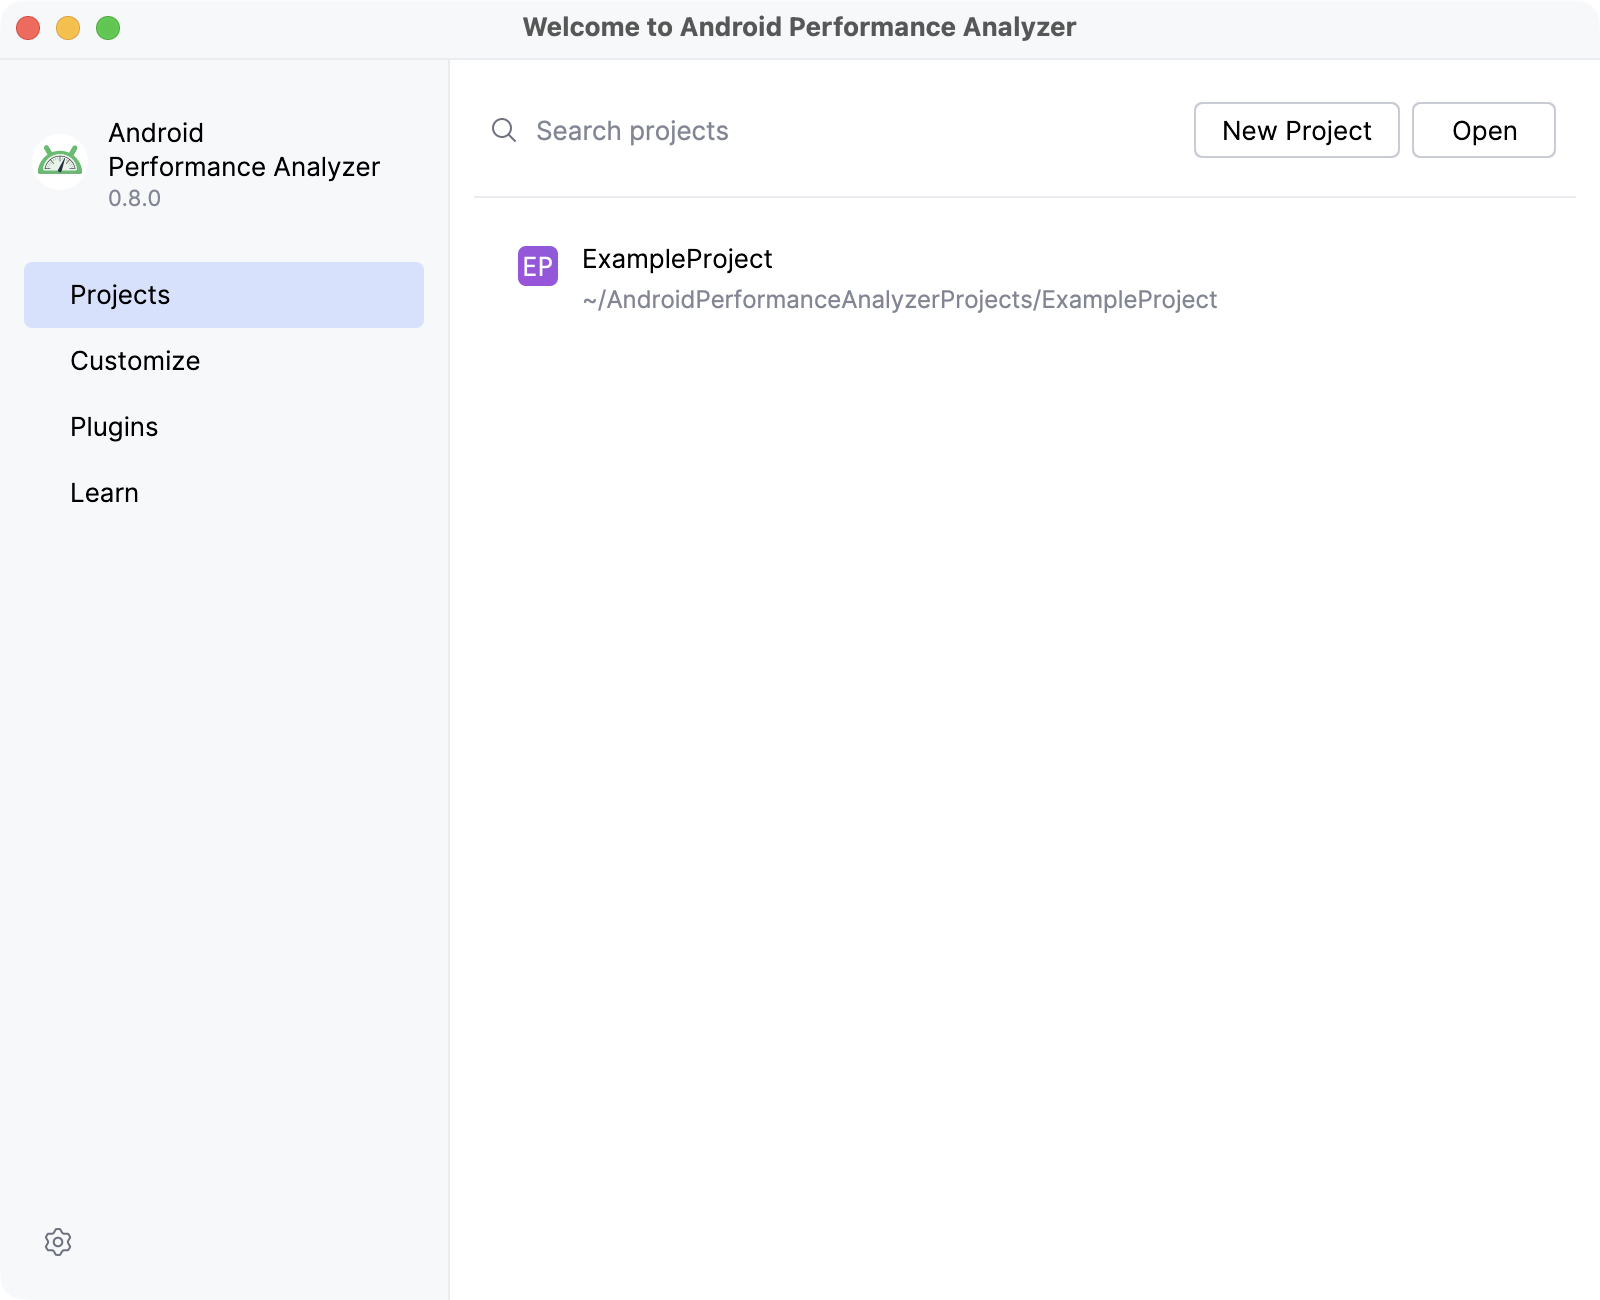
Figure 1: A screenshot of the Welcome to Android Performance Analyzer startup window. Type a name and a directory location for your new project. Android Performance Analyzer opens your empty project automatically.
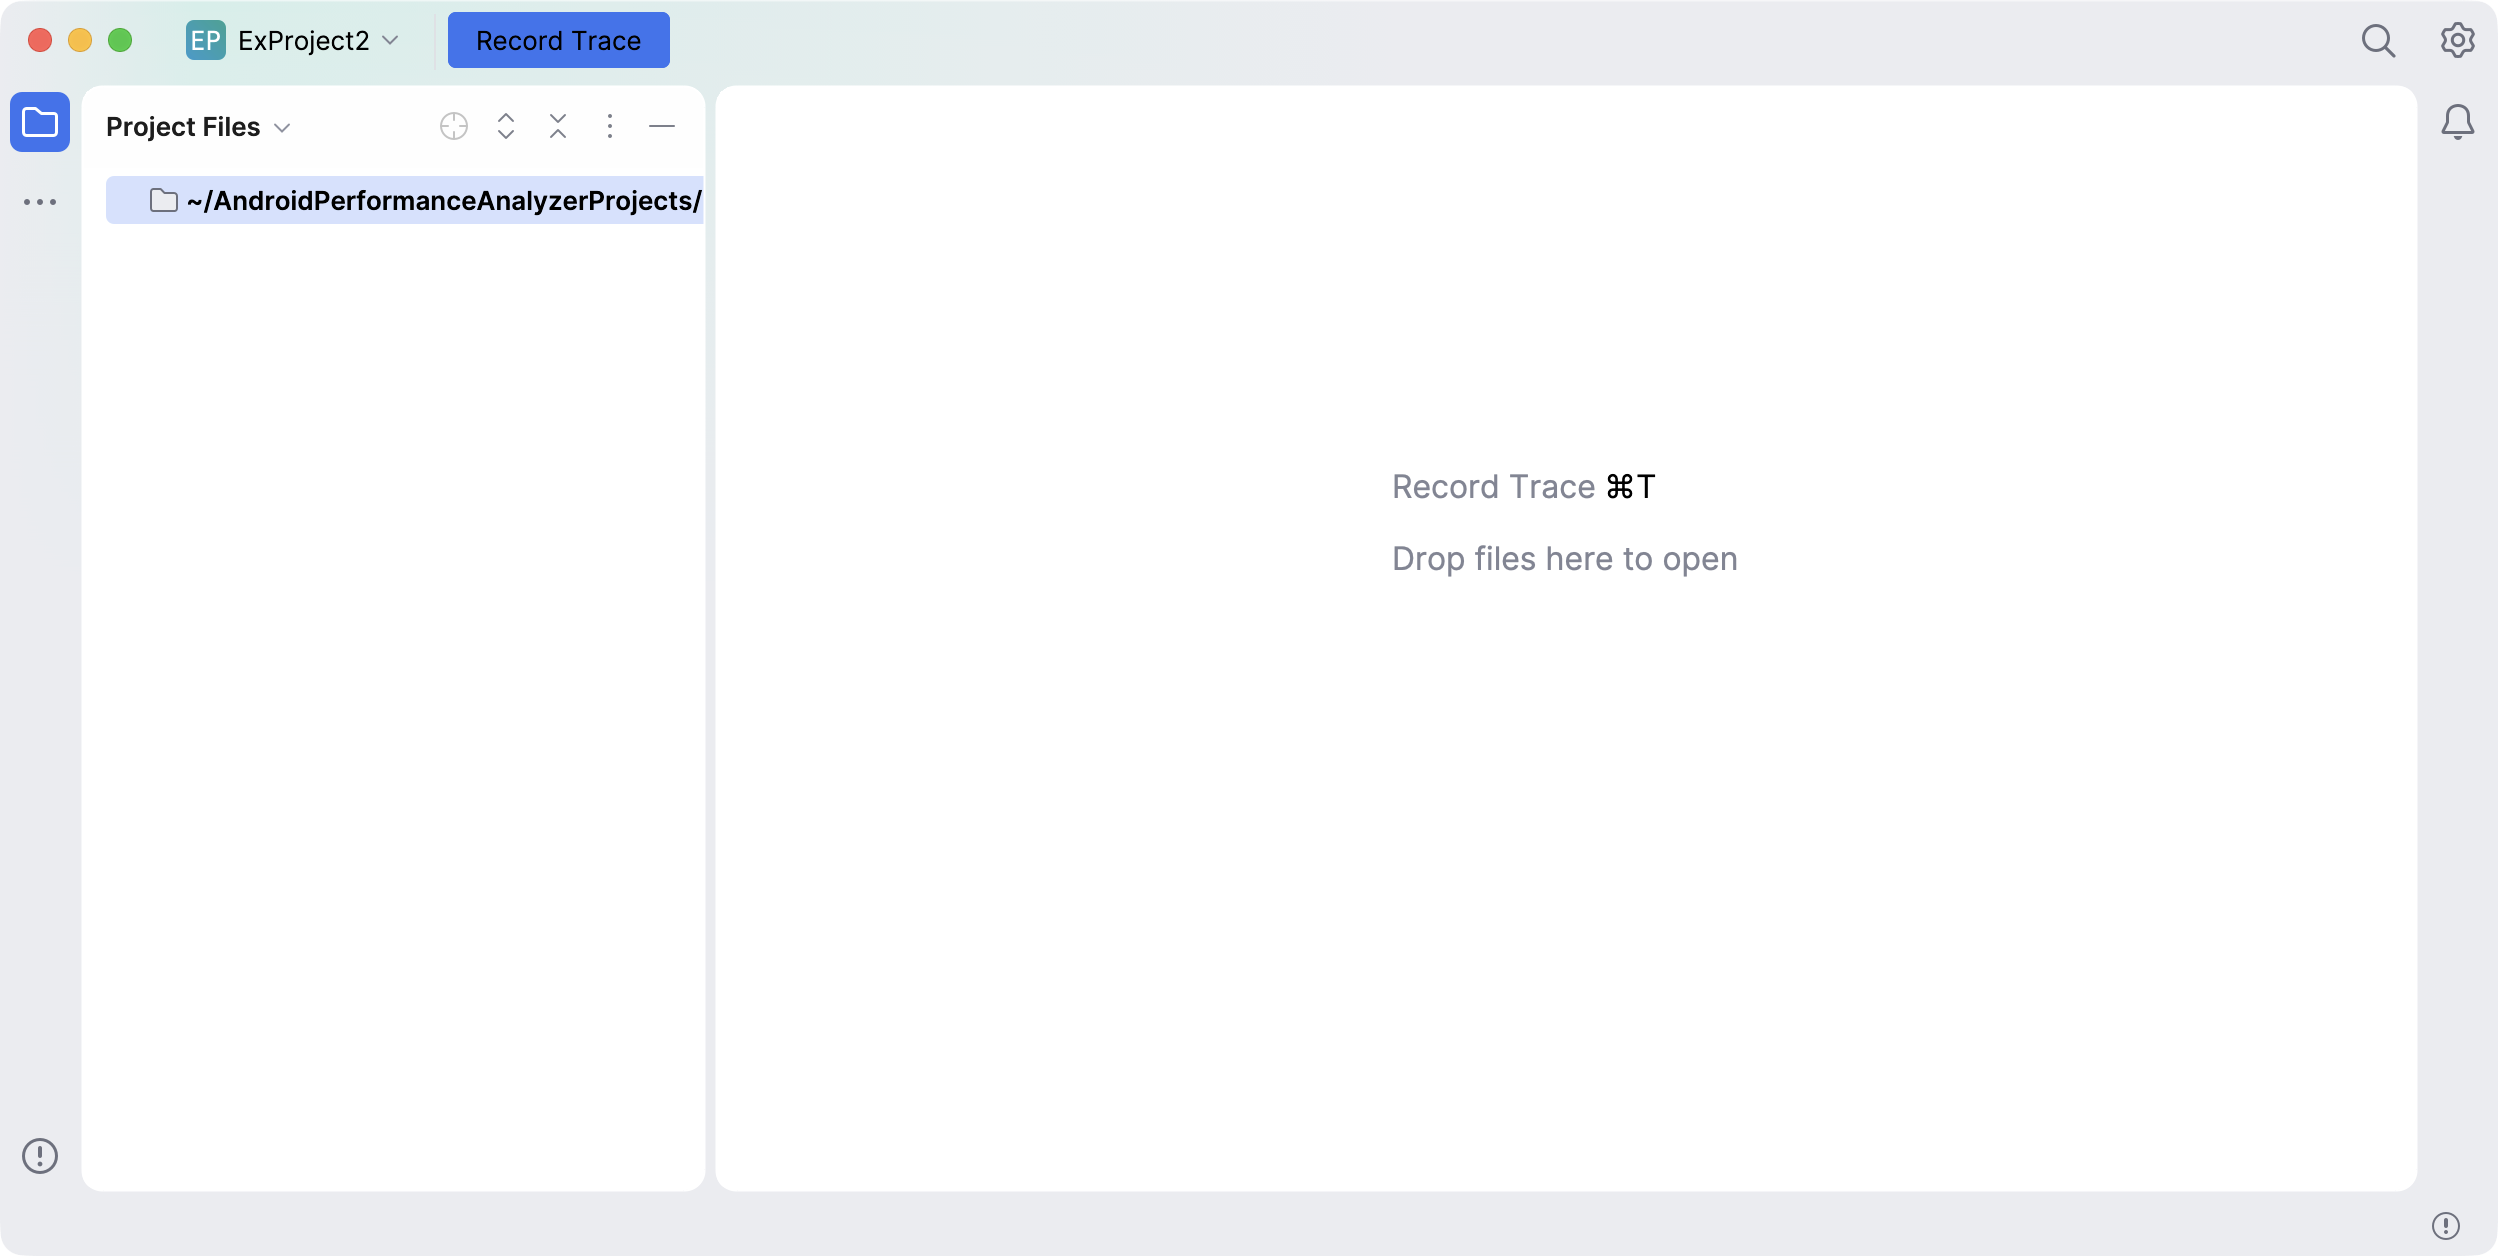
Figure 2: A screenshot of an empty project. Click the Record Trace button on the left side of the title bar to open the Configure a Recording window.
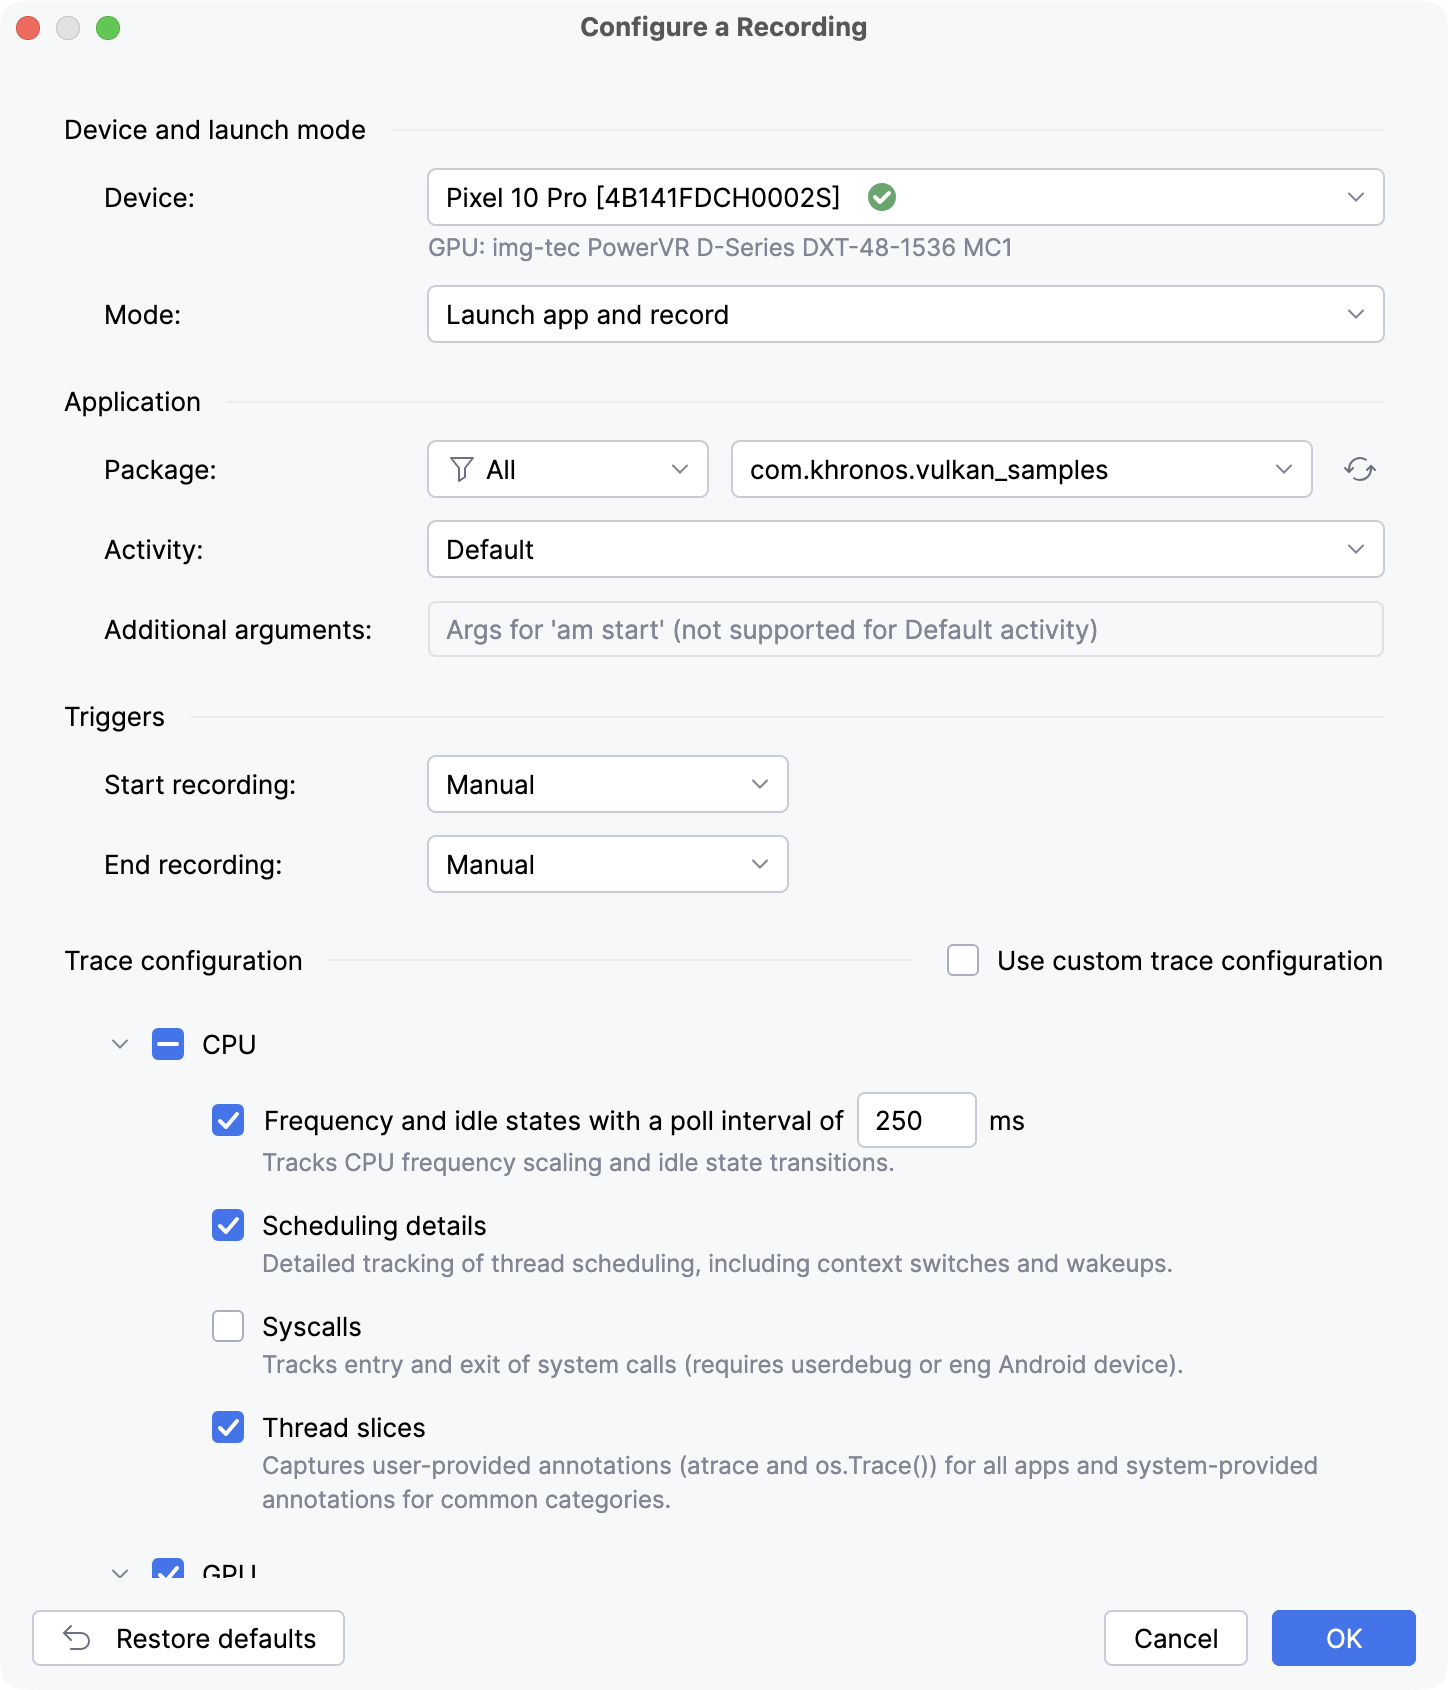
Figure 3: A screenshot of the Configure a Recording window. The Configure a Recording window initially opens with the default trace configuration. Adjust the options according to your needs and click OK. This opens the Control Recording window and automatically starts the app on your testing device.
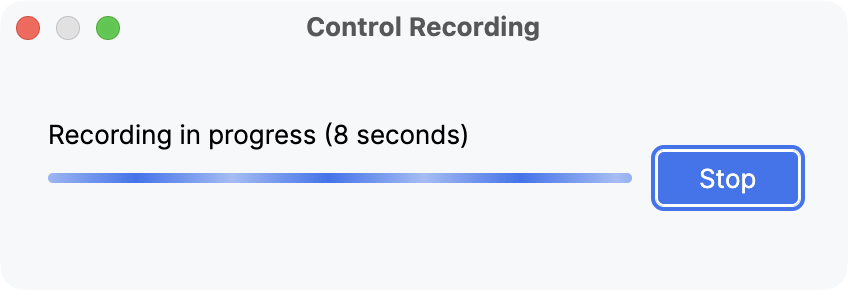
Figure 4: A screenshot of the Control Recording window. Run your test. The trace runs until you click Stop or until the preset duration runs out (if you set one). Android Performance Analyzer retrieves the trace data, then opens the results in the trace view automatically.
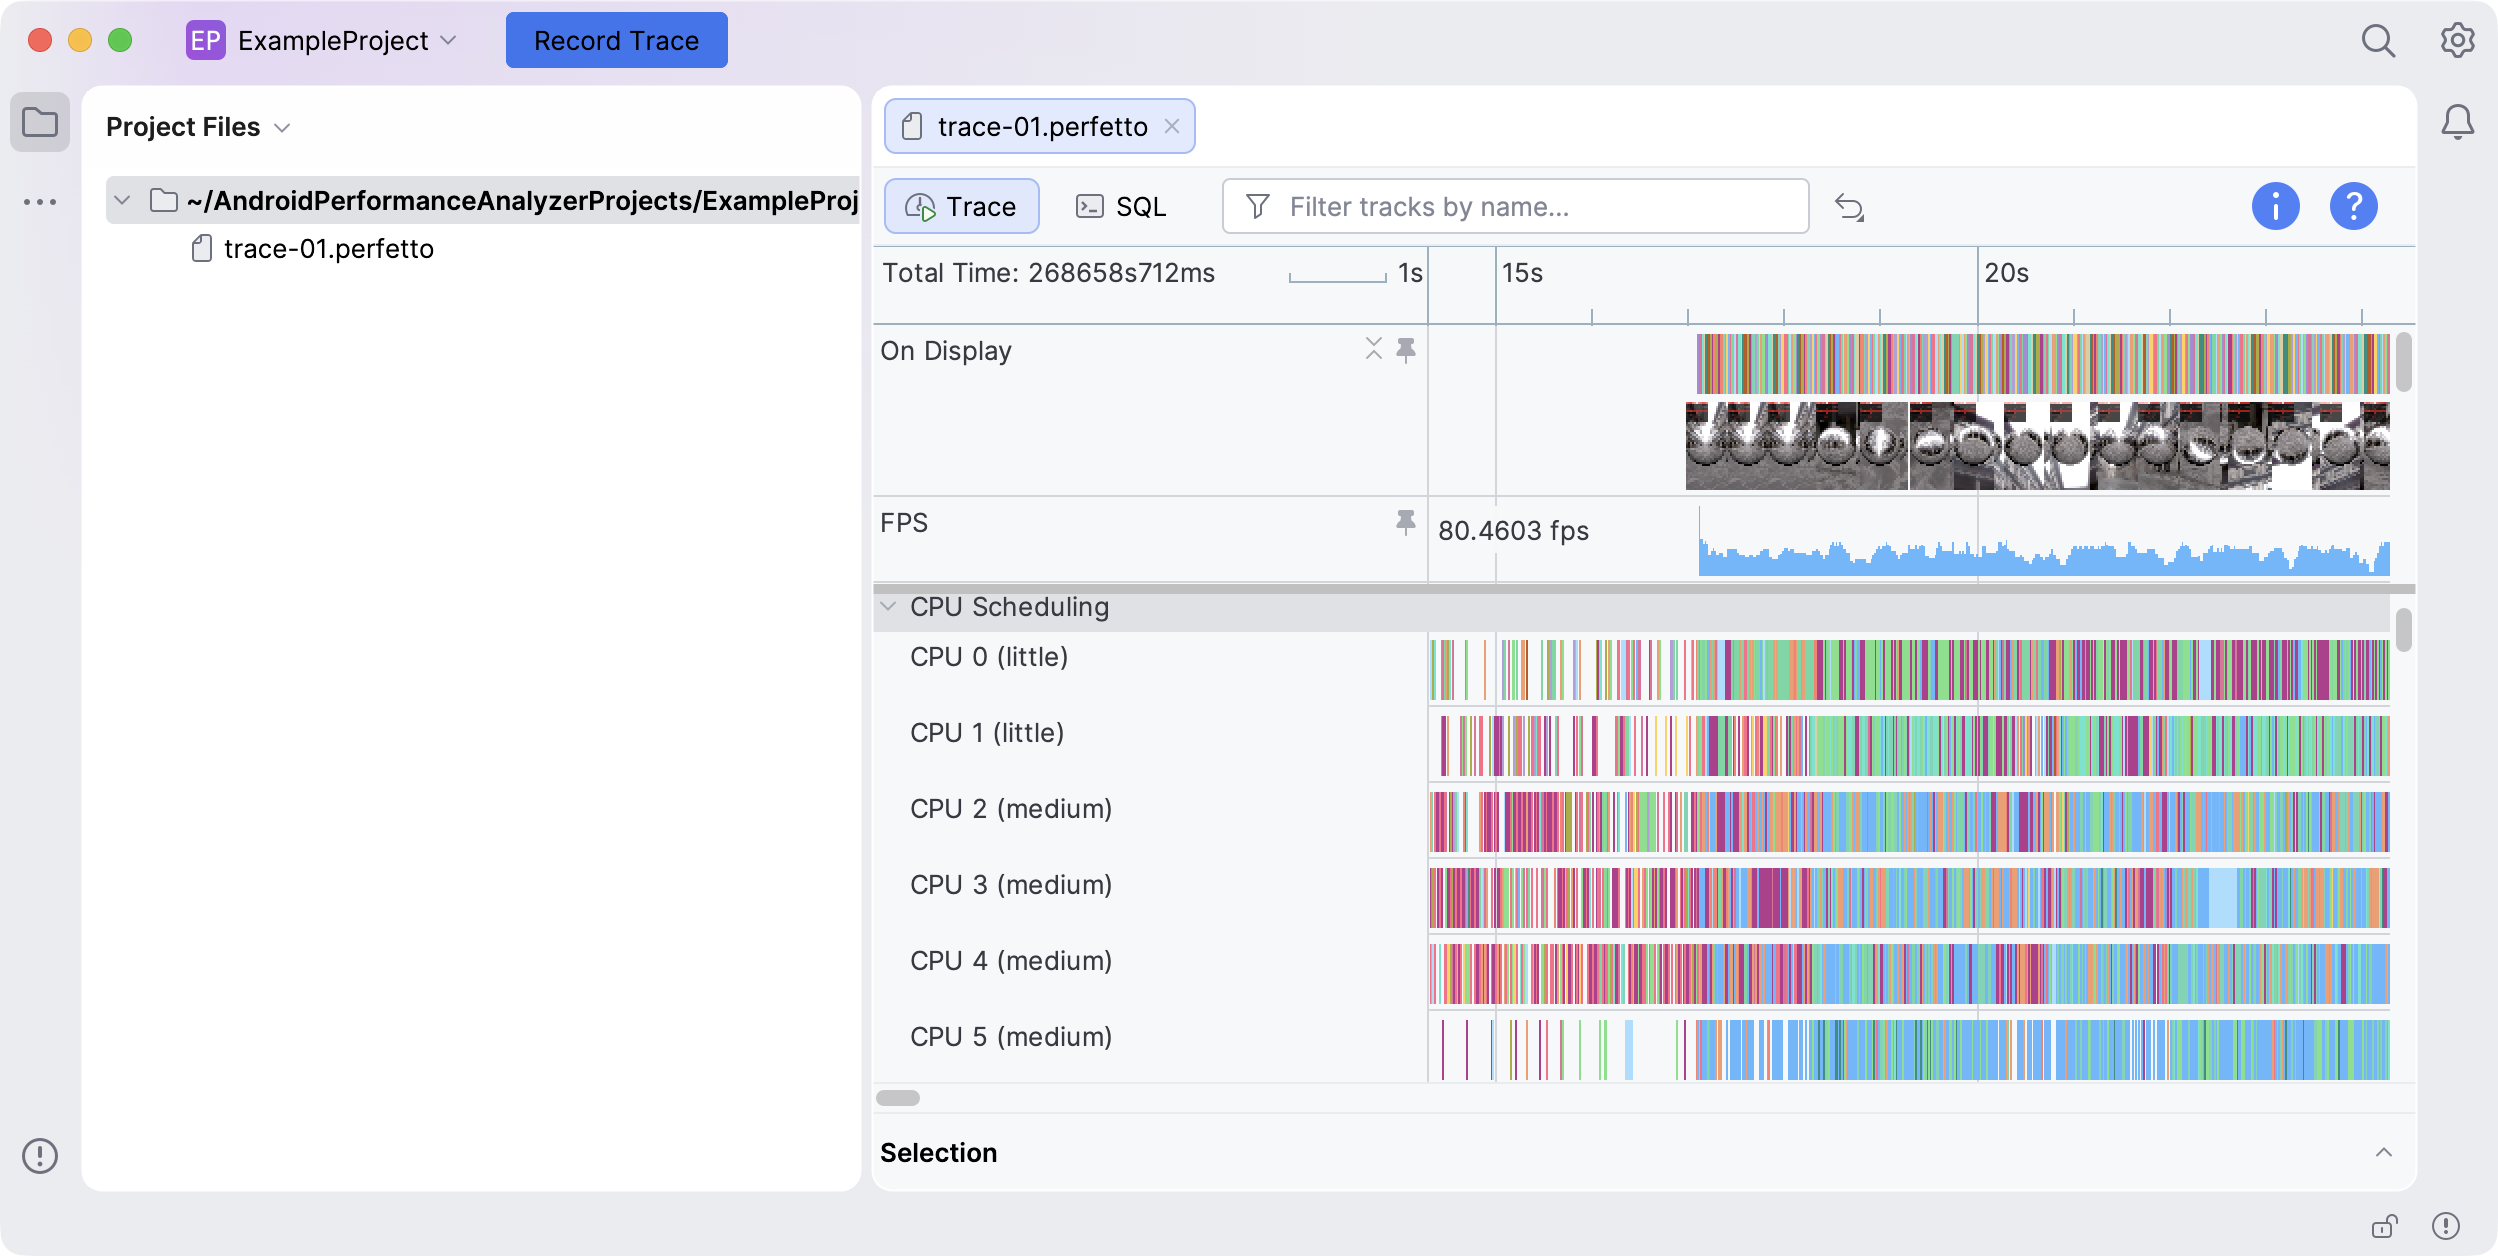
Figure 5: A screenshot of an example trace view. Use the trace view to interact with and analyze the collected data.
Next steps
For more in-depth guidance on using the the System Profiler in Android Performance Analyzer, see Record a system trace and View a system trace.