The System Profiler in Android Performance Analyzer provides a wide range of tracing options and GPU performance measurements for your Android app or game. This guide provides in-depth information about how to configure and run a system trace that meets your needs.
Record a trace
After you've created a new project or opened an existing one, you can click the Record Trace button on the left side of the title bar to open the Configure a Recording window.
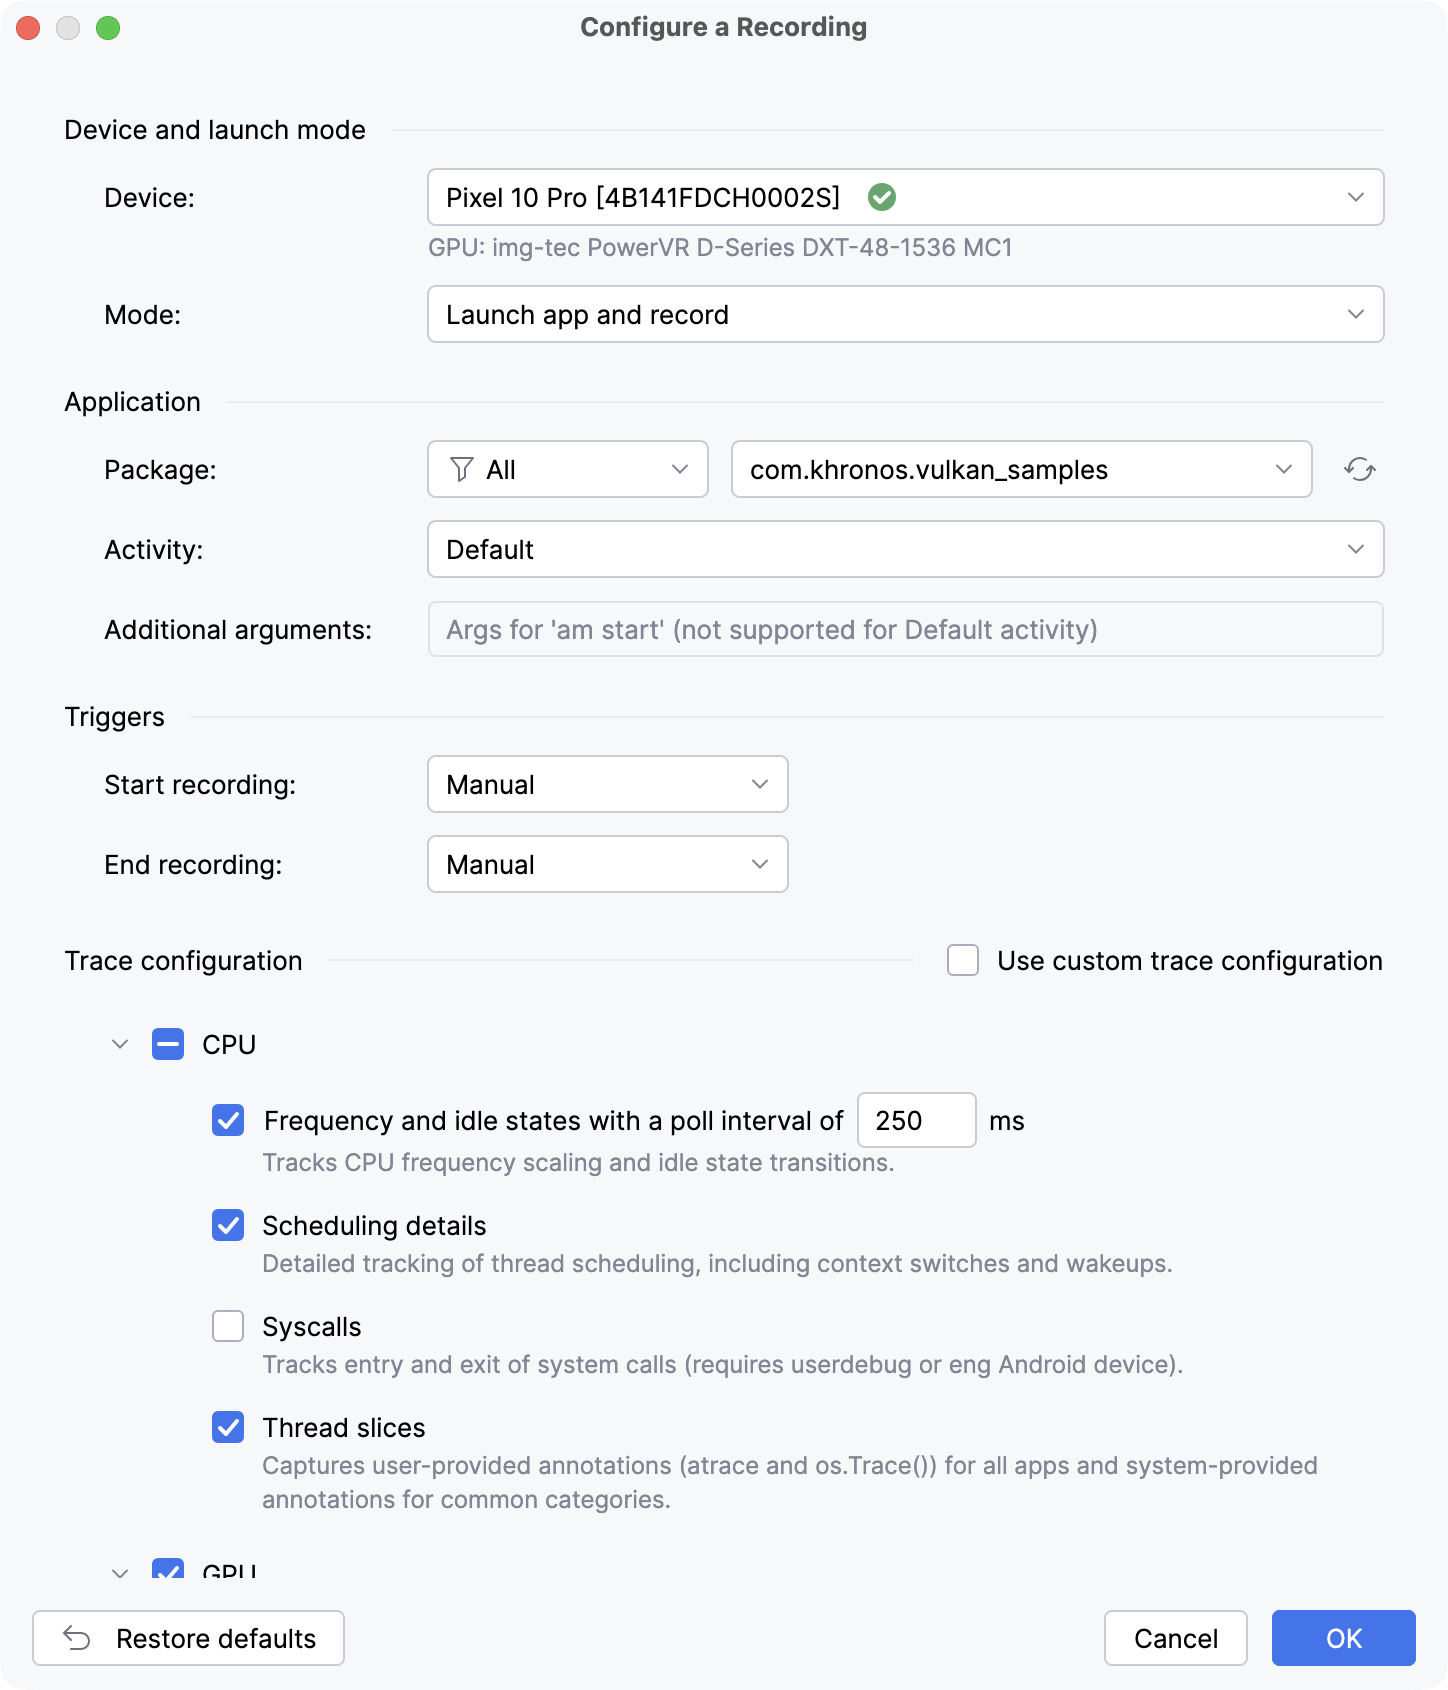
From this window, you can configure your profiling options and begin the trace by clicking OK.
Configure a recording
In the Configure a Recording window, you can configure your trace prior to running it. You can click the Restore defaults button at any time to return to the default trace configuration.
Basic options
This section describes the basic options you can set for your trace.
Device and launch mode
The Device drop-down selects a connected device to use for testing.
The Mode drop-down selects a launch mode:
- Launch app and record - Opens the target app automatically after starting to record.
- Record a running app - Begins recording without launching an app.
Triggers
The Start recording drop-down sets a trigger to begin the system trace. Only Manual is available if you're using the Record a running app launch mode.
- Manual - The Control Recording dialog displays a Start button which you click to begin the recording.
- On Startup - The recording begins immediately when the test app starts up.
- On Startup with Delay - The recording begins a specified amount of time after the test app starts up.
The End recording drop-down sets a trigger to conclude the trace.
- Manual - The Control Recording dialog displays a Stop button which you click to end the recording.
- Duration - The recording runs for the specified duration and then stops automatically. You can still end the recording early using the Stop button.
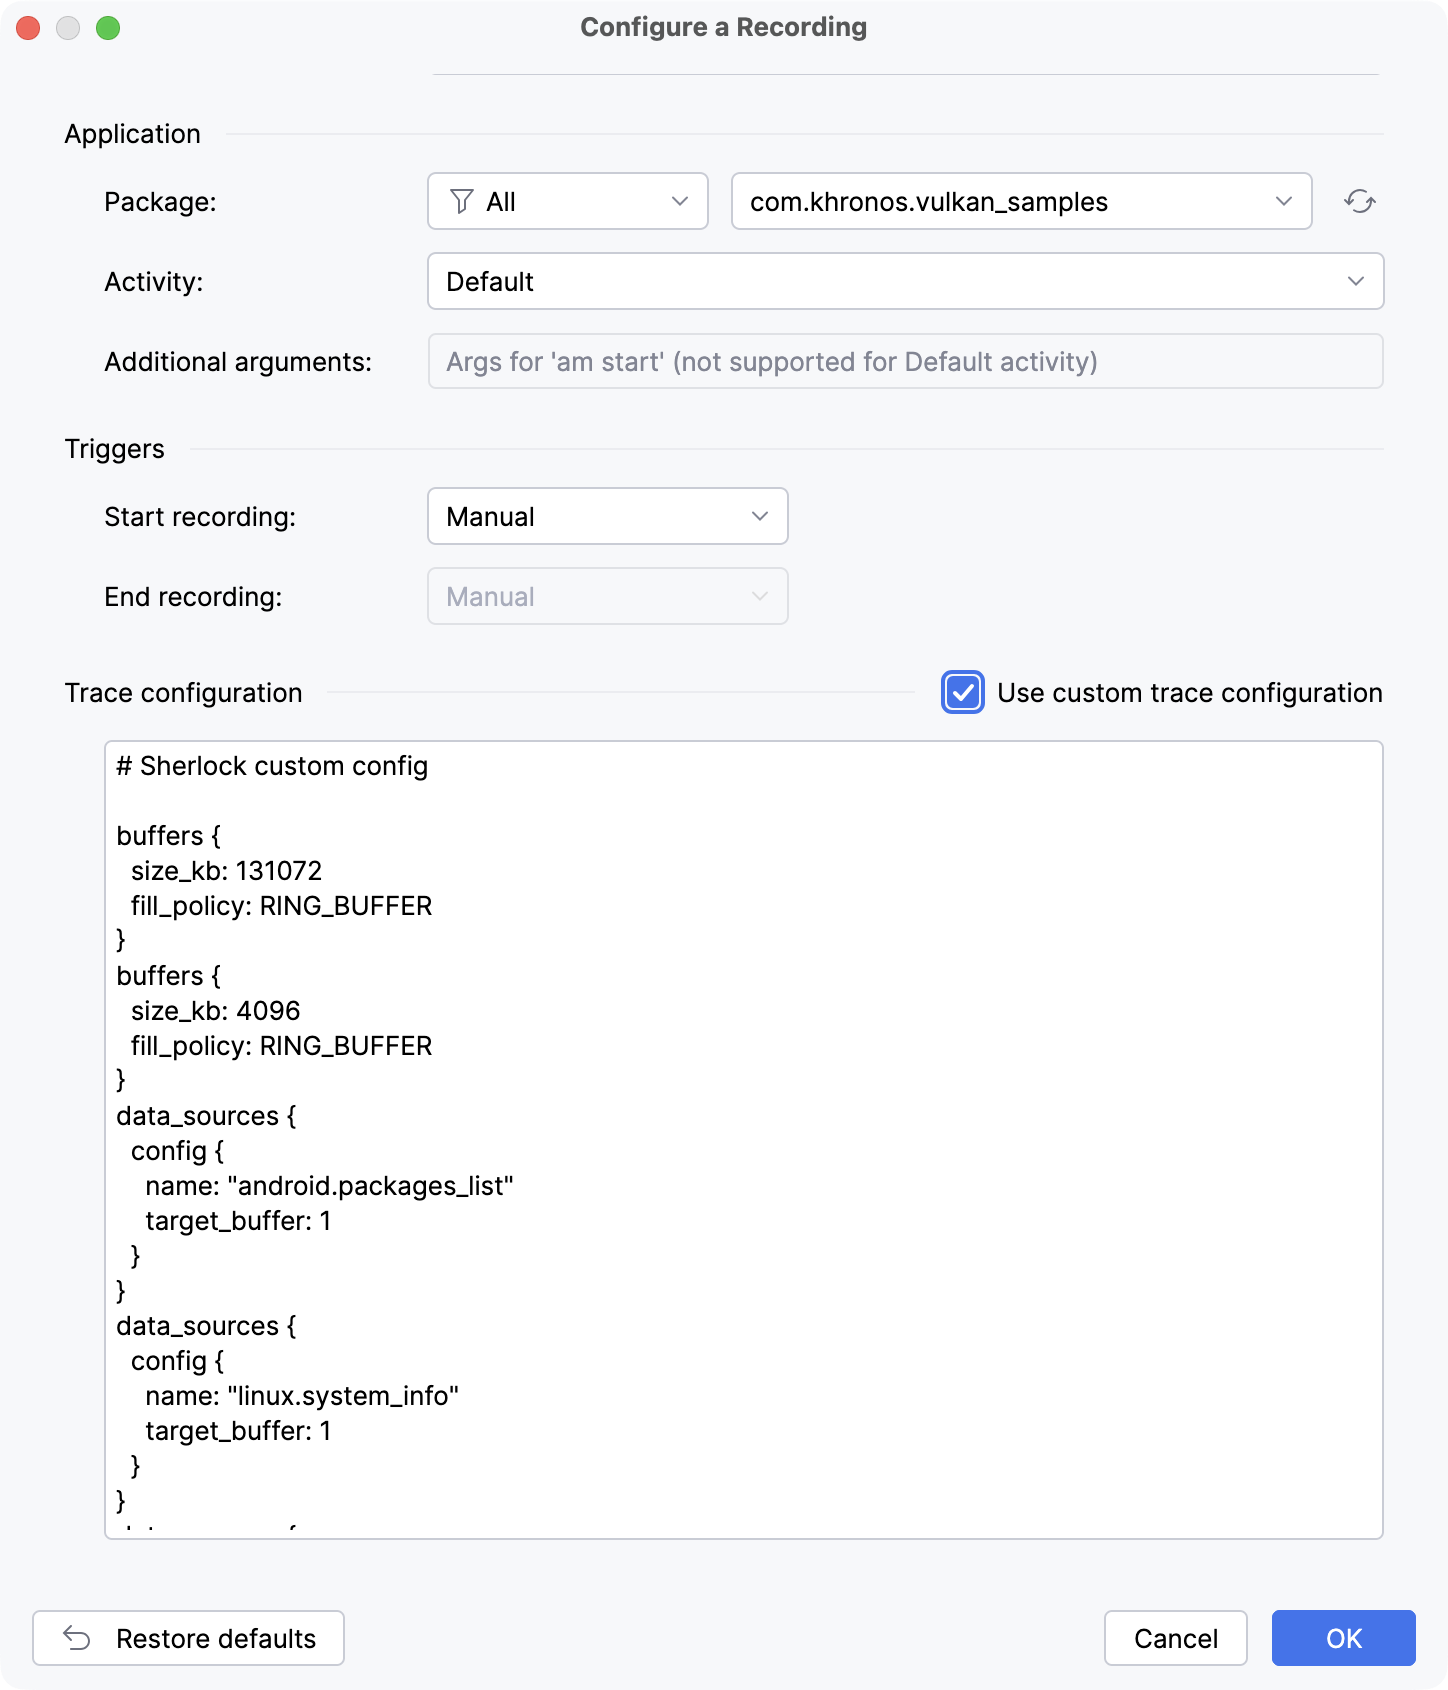
Trace configuration
The System Profiler in Android Performance Analyzer collects a standard set of CPU and GPU metrics by default, but you can also use the options in this section to specify exactly what data to record. The Use custom trace configuration checkbox allows you to use a custom Perfetto config proto instead.
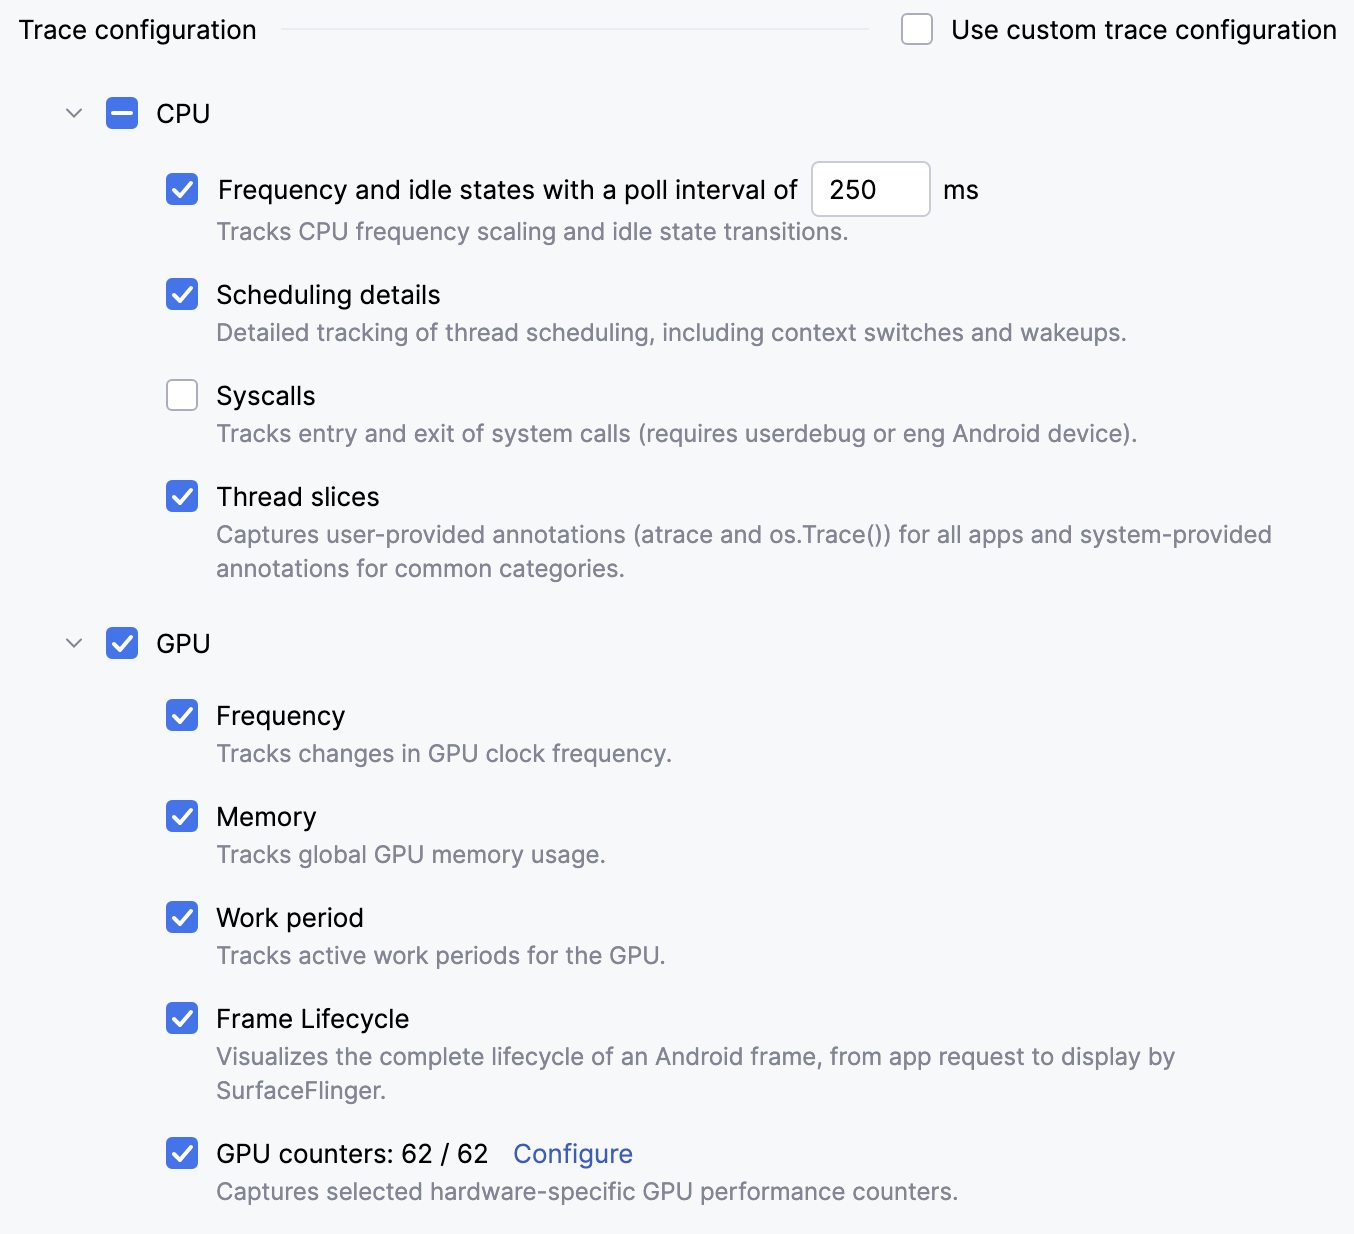
To minimize the performance impact on your testing device when you profile the system, select fewer data sources for traces lasting more than a minute. For traces lasting less than a minute, you can select all data sources with minimal impact. For more information on the profiling data you can collect, see Understand trace data.
Configure GPU counters
Click the Configure button next to the GPU counters label to open a GPU Counters window where you can view all counters available for your GPU and select which ones to record for your trace.
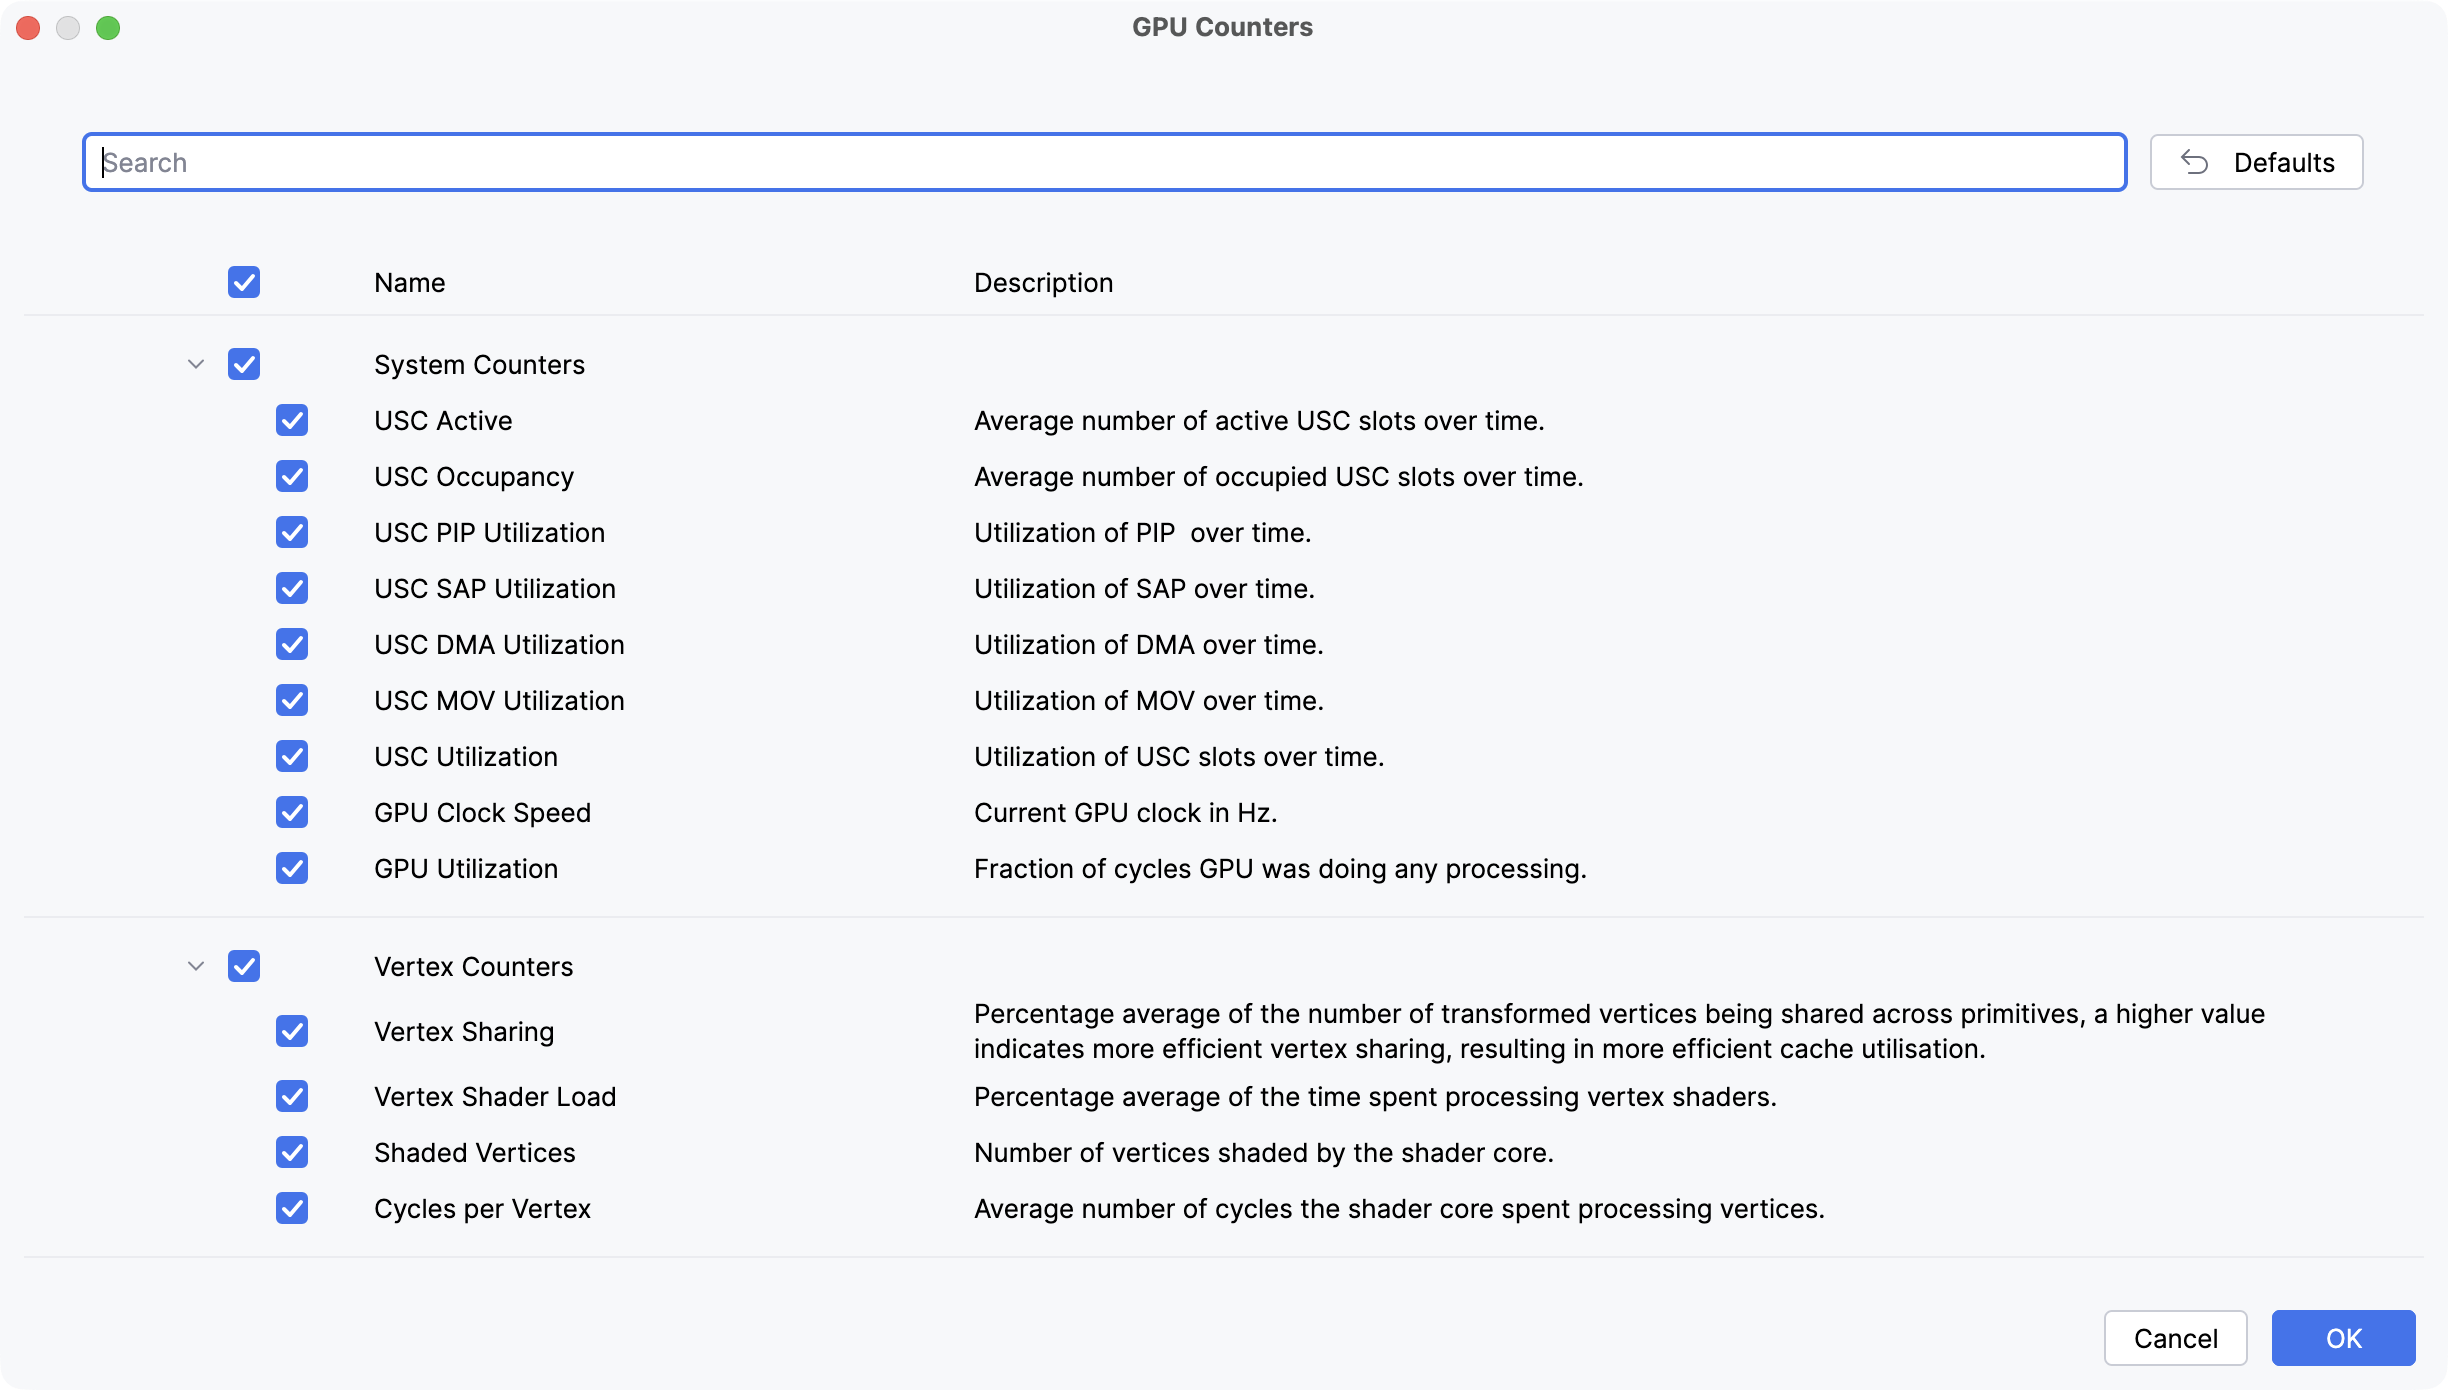
For more information about GPU performance counters, see the OEM documentation for your GPU.
Use a custom config proto
You have the option of entering a custom Perfetto TraceConfig proto instead of manually configuring your trace. Click the Use custom trace configuration checkbox to replace the Trace configuration section with a text field. When you switch to custom config entry, Android Performance Analyzer automatically populates the field with a TraceConfig proto that matches what's currently configured in the UI. You can edit it as needed.
Vulkan Layers
Android Performance Analyzer can inject Vulkan layers that intercept Vulkan API calls and emit additional debugging data. You have the option of collecting CPU timing for all Vulkan API calls, debug names for Vulkan render passes and frame screenshots.
CPU timing layer
The CPU timing layer shows the timing of Vulkan API calls as slices on the threads that made each call. To collect this data, check the box labeled CPU Timing under the Vulkan Layers section.
Render pass debug names
Android Performance Analyzer supports Vulkan debug annotations for render passes. This lets you see render passes in the trace view under custom names that you've set for them in your codebase. To collect this data, check the box labeled Render Pass Debug Names (Experimental) under the Vulkan Layers section.
Screenshots
You can collect frame screenshots alongside the rest of the trace data by checking the box labeled Screenshots (Experimental) under the Vulkan Layers section.
Output
The Output file name field in the Output section lets you define a custom name for the trace file generated by the current trace. You can also use the following variables in a custom trace file name:
${device_model}- The model of the testing device.${device_name}- The name of the testing device, as shown in About phone > Device name.${device_serial}- The serial number of the testing device.${package_name}- The package name for the app under test.${package_name_short}- A shortened form of the package name for the app under test.${timestamp}- A timestamp indicating when the trace file was created.
You can preview the final filename after variable substitutions below the Output file name field.