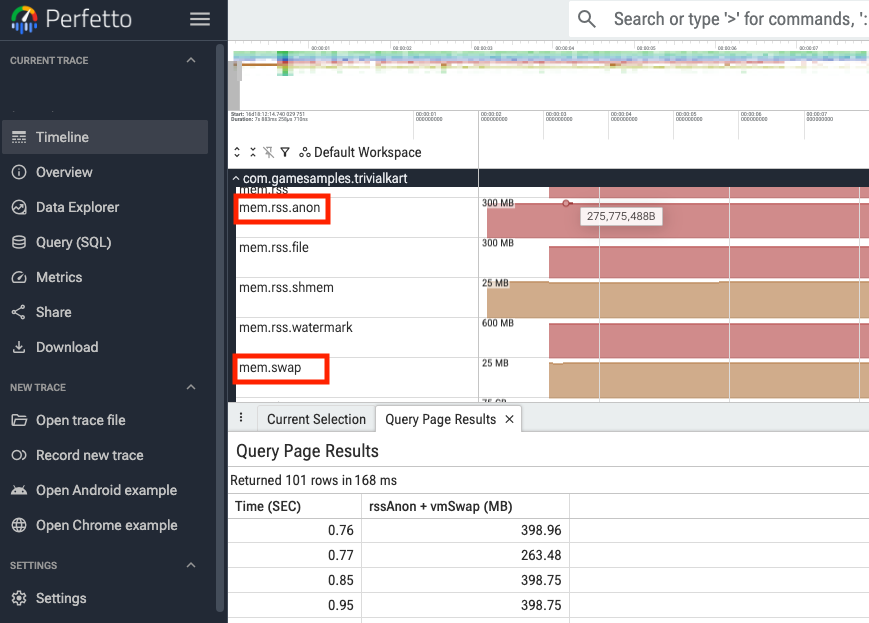
在 Android 系统中,内存 限制器 (Android 17 及更高版本)的内存限制阈值和 Google Play 管理中心内内存 Vitals 的基准值均为“匿名 RSS + 交换空间”。此值表示进程实际占用的物理内存压力级别,是必须监控的关键指标,以确保应用稳定运行。
目前,无论是运行时还是在 Unity 引擎中静态地,都很难测量与“匿名 RSS + 交换空间”完全匹配的内存用量。
为了解决这个问题,本页介绍了如何在 Unity 引擎环境中使用 Unity Profiler、ProfileRecorder API 和 Unity Memory Profiler 通过近似值以高可靠性跟踪“匿名 RSS + 交换空间”值。
在运行时检查内存用量
在 Unity 中,直接测量 Android 的确切“匿名 RSS + 交换空间”内存 用量而不产生开销可能具有挑战性。不过,您可以使用 Unity 的内置 Profiler API 密切估算此值(方差在 10% 左右)。
方法 1:使用 Profiler
您可以通过对以下 Profiler API 返回的值求和来估算总内存用量:
using UnityEngine;
using UnityEngine.Profiling;

public class MemoryMonitor : MonoBehaviour
{
    public long GetEstimatedMemoryUsageBytes()
    {
        long totalReserved = Profiler.GetTotalReservedMemoryLong();
        long monoHeapSize = Profiler.GetMonoHeapSizeLong();

        return totalReserved + monoHeapSize;
    }
}
方法 2:使用 ProfilerRecorder 类
您可以使用 ProfilerRecorder 跟踪预留内存总量 和 Gfx 预留内存 指标:
在开发 build 中:计算“预留内存总量” - “Gfx 预留内存”。
在发布 build 中:直接使用“预留内存总量”。
using Unity.Profiling;
using UnityEngine;

public class MemoryMonitor : MonoBehaviour
{
    ProfilerRecorder totalRecorder;

#if DEVELOPMENT_BUILD
    ProfilerRecorder gfxRecorder;
#endif

    private void OnEnable()
    {
        totalRecorder = ProfilerRecorder.StartNew(ProfilerCategory.Memory, "Total Reserved Memory");

#if DEVELOPMENT_BUILD
        gfxRecorder = ProfilerRecorder.StartNew(ProfilerCategory.Memory, "Gfx Reserved Memory");
#endif
    }

    private void OnDisable()
    {
        totalRecorder.Dispose();

#if DEVELOPMENT_BUILD
        gfxRecorder.Dispose();
#endif
    }

    public long GetEstimatedMemoryUsageBytes()
    {
#if DEVELOPMENT_BUILD
        if (totalRecorder.Valid && gfxRecorder.Valid)
        {
            return totalRecorder.LastValue - gfxRecorder.LastValue;
        }
#else
        if (totalRecorder.Valid)
        {
            return totalRecorder.LastValue;
        }
#endif
        return 0;
    }
}
限制:
绕过 Unity 的内存管理器(例如 NativeMalloc(IntPtr size))的内存分配无法通过这些 API 进行跟踪。
这些 API 可能不受支持,具体取决于您的 Unity 版本。
分析内存细分(静态分析)
如果在运行时检测到内存用量过高,您需要确定内存的消耗位置。通过分析内存分配,您可以消除不必要的分配并减少游戏的总体内存占用空间。
Unity Memory Profiler
如需执行深入的内存分析并优化游戏,请使用 Unity 内存分析器 软件包。如需找到与 Android OS '匿名 RSS + 交换空间' 用量对应的项,请执行以下操作:
- 使用 Unity 内存分析器 捕获快照。
- 打开快照,然后依次前往 All of Memory > Resident Memory on Device 。
计算以下各项的总和:
- Untracked
- Android 运行时
- 原生
- 托管式
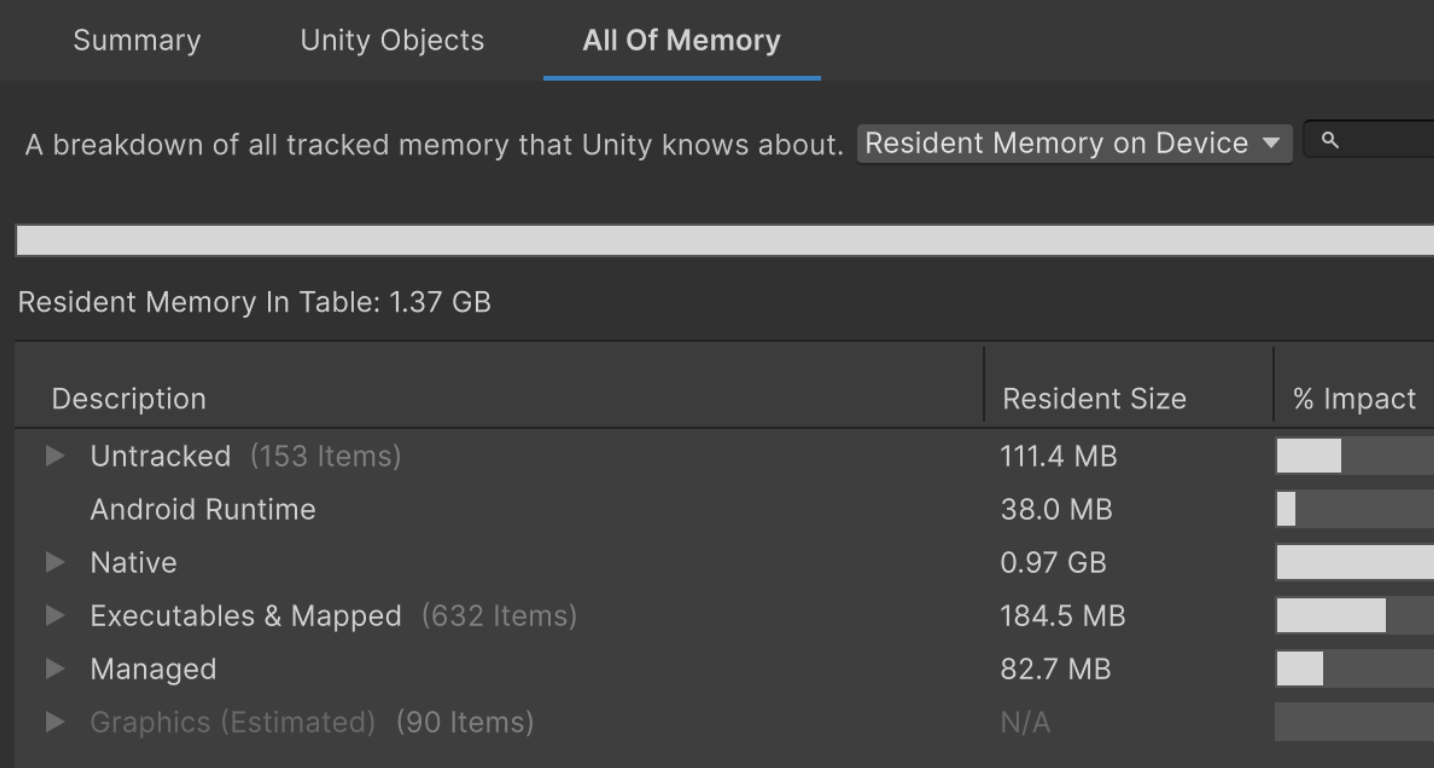
图 1.内存说明存储在常驻内存中
总和可作为 Android OS“匿名 RSS + 交换空间”的实用替代项,为游戏内存分析提供切实可行的洞见。
限制:
在内存压力过大的情况下,Android OS 可能会压缩或交换活跃内存页以释放 RAM。由于 Unity 内存分析器 无法跟踪交换的内存,因此在高内存用量场景中可能会出现差异。
这些功能可能会受到限制,具体取决于您的 Unity 版本。
C# 脚本示例
您可以参阅 AndroidAndroidProcessStats.cs 和
GameMemoryMonitor.cs 脚本,了解如何在运行时监控游戏进程的状态和
内存占用空间。
AndroidProcessStats脚本演示了如何使用 JNI(Java 原生接口)链接到 AndroidActivityManagerAPI,并提供用于提取正在运行的进程、其重要性和操作系统级状态的功能。它还包含用于直接从 Linux/proc文件系统读取内存统计信息的轻量级方法。GameMemoryMonitor脚本展示了如何挂钩此信息以进行持续监控和调试,包括如何在后台线程中轮询 Android API 以防止性能开销(因为使用 JNI 和轮询内存信息可能会产生高昂的费用),以及如何在应用暂停或恢复时挂钩生命周期事件(如OnApplicationPause)以跟踪内存变化。
如需使用这些工具,请将这两个脚本添加到 Assets 文件夹,并将 GameMemoryMonitor 脚本附加到场景中的 GameObject。
更准确的评估
如需验证确切的 Android OS“匿名 RSS + 交换空间”值,请使用 Perfetto。借助该工具,您可以测量精确的系统级内存用量,并彻底分析游戏的内存占用空间。